Geographers (Rimmer, 1967) and historians (Person, 1985) early addressed certain critiques to existing port-city and port-hinterland studies of which the vast majority did not take into account the “land-sea continuum” or the configuration of maritime flows in such analyses, should they be monographs of individual places or wider regional analyses of so-called “port systems”. A deep investigation into the cartography of maritime transport based on actual data revealed that between the 1940s and the 2000s (Ducruet, 2016), only a few geographers produced visualizations of world shipping routes in unknown PhD dissertation or academic articles. From the 2000s onwards, studies of maritime networks and land-based networks grew apace but mainly separately from each other, except from the perpetuation or critique of André Vigarié’s (1979) supposedly outdated “port triptych model” replaced by several conceptual studies shifting the core focus from port-centric to chain-centric (Van Klink, 1998; Robinson, 2002; Notteboom and Rodrigue, 2005).
Land-sea interaction is not only about pure logistics, transportation and intermodalism; it is also linked with wider issues of modal shifts (cf. Marco Polo programmes, Motorways of the Sea), but also energy impacts of congestion at certain port nodes or transport corridors, fostering the need for concrete action [1] from the European elites, such as Transport Ministries, universities, and consulting firms that master the multidimensional character of this core issue in Europe and elsewhere. Unfortunately, rigorous scientific methods remain lacking when it comes to actually and objectively assess land-sea interactions, especially from a spatial analysis perspective, thereby complementing the often promising discourses of the various stakeholders mainly focused on the micro-level of specific projects and places, thus lacking the global perspective.
This contribution is thus a first attempt to propose a systematic analysis of the combined road and maritime network using state-of-art methods from geomatics, cartography, and network analysis as detailed below, and taking inspiration from a handful of earlier works on the matter having had different approaches and outcomes (Chapelon, 2006; Nelson, 2008; Halim et al., 2015; Guerrero et al., 2017; Shen, 2017); the vast majority of other studies being more qualitative and focused on actors and firms rather than network architecture, through the analysis of intermodal services and vertical integration (see van Klink and van den Berg, 1998; Franc and Van der Horst, 2010; Bottasso et al., 2018; Notteboom et al., 2017) dry ports and ro-ro (Roso et al., 2009; Torbianelli, 2010), and hinterland delineation (Zanon Moura et al., 2017).
After presenting the main procedures behind the modelling of a global land-sea network, we propose an application to Irish and United Kingdom ports and cities as a first step in such a direction.
Creating a combined maritime and continental network
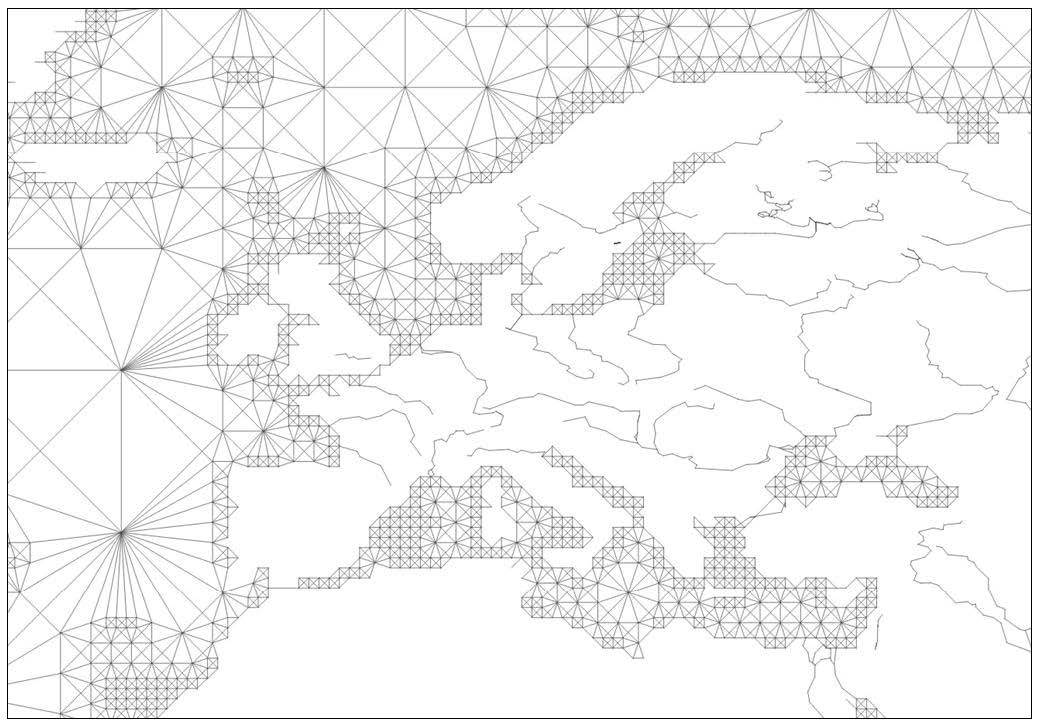
To meet the project’s needs in terms of visualisation and analysis, one of the first step was to create a maritime grid that would cover the entire world and allow to map and analyse real shipping flows (vessel movements) tediously extracted from the Lloyd’s List corpus (see Bunel et al., 2017 and Ducruet and Bunel, 2017a for deeper methodological details, and Ducruet and Bunel 2017b, Ducruet and Berli, 2018; Wang et al., 2018 for concrete utilization of this maritime grid to map and analyse real shipping data). We provide, in Figure 1, a zoom on Europe to better observe the details of the theoretical maritime grid that is destined to be linked to land areas. This is mainly based on the principle of a higher grid density along the coastlines, to allow a high level of precision in terms of how will neighbouring ports, distant from a few kilometres, keep their unique connectivity on both sea and land sides. Thus, the next step was the enhancement of this spatial graph by the addition of a continental graph linking each ports and cities. This combination is the core methodological advance proposed by this research note, with an application to Great Britain.
To properly process the road network to create an actual graph, it is first mandatory to obtain worldwide datasets and reduce their density. OpenStreetMap (OSM) [2] road sections offer the most complete and precise solution, mainly for the recent period (2000 to 2020). Our ongoing research also aims to better understanding the maritime accessibility of non-port (inland) cities, the land accessibility of port (coastal, downstream or upstream) cities, and to complement analyses of cities only based on maritime flows (see Bretagnolle, 2015; Ducruet et al., 2018, thereby giving paramount importance to dominant maritime hubs despite their low land-based connectivity (e.g. Singapore, Dubai, Marsaxlokk, Tangier, Kingston) and concluding to a decline of port-city relationships not only due to respective urban and port changes but mainly with the overwhelming dominance of land transport overtime.
First, a model has been created to reduce the high density of OSM road sections, including all possible segments from motorways to residential and smallest streets. An iterative division of the world was deployed to split continents into small squares that shall not include more than 20 nodes (i.e. ports and cities) to ensure a reasonable amount of road sections in each created cell. Then, the model goes through four distinct stages:
- Discrimination of road segments according to their OSM classification. A primary road system is extracted to provide a robust structure to which ports will be connected, including motorways, trunk and primary road sections. Coastal areas are calculated; they correspond to areas standing between the obtained primary road network and the coastline itself, sometimes overlapping water (e.g. bridge crossing an estuary or river);
- Contextual extraction of secondary road sections located inside littoral areas. This phase keeps only road segments connecting ports, based on the closest and lower level road. It complements the primary network taking into account source and target nodes as well as a cost that depends on speed limits and topological distance. Finally, the resulting routable network is simplified using an algorithm that calculate ever shortest paths (or potential routes) between every port and city. In the end, only necessarily used roads are kept; it heavily reduces the amount of roads;
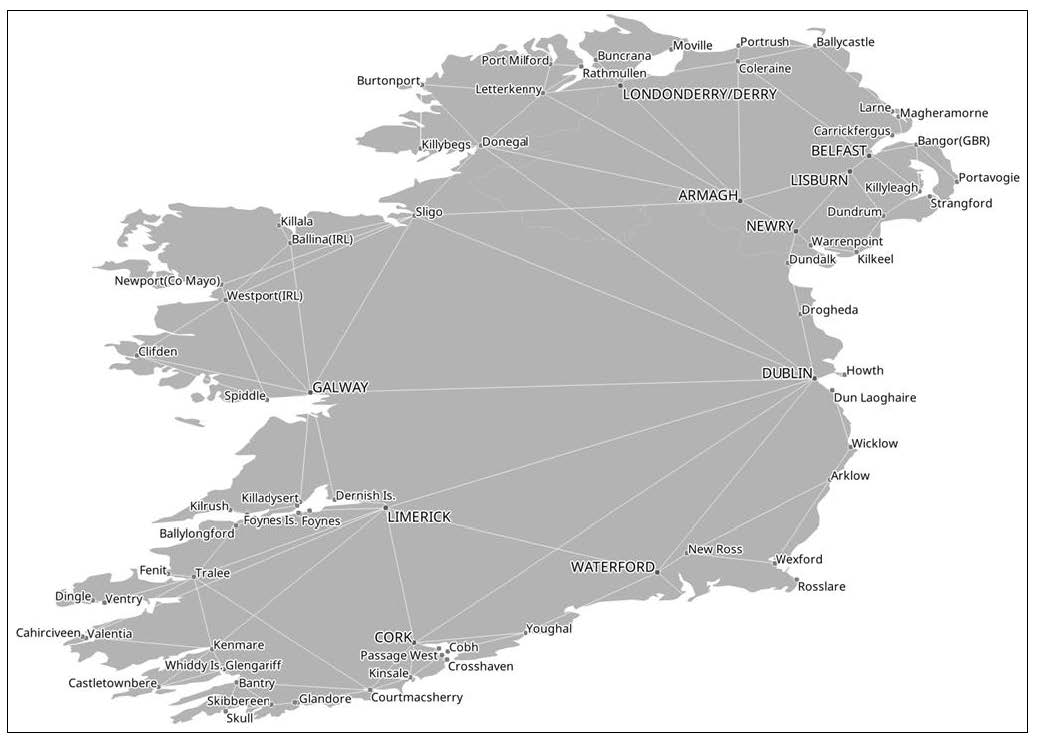
- Network simplification and spatial graph creation. As for the maritime grid, the goal is to obtain a skeleton in which nodes represent either cities or ports connected by weighted links based on pre-computed costs or topological distances. The area of influence is created for cities and ports using buffers to build those areas and run the model; then they are merged if overlapped. Finally, Voronoi polygons allow dividing them according to the number of overlapping ports and cities. When those areas are clearly defined, potential routes between every ports and cities are calculated, keeping only direct links (i.e. potential routes that intersect no more than two city/port, namely their origin and destination). Finally, a new geometry creates simple lines connecting start and end points of the routes (see Figure). Such an automated approach to create a spatial graph inevitably necessitated manual corrections to add missing links or remove certain ones;
- Connexion of ports to the maritime grid. This constitutes the ultimate step before the creation of a bi-modal or intermodal (maritime routes and continental roads) global graph. To achieve this goal, it has been decided to calculate clusters of ports according to their localisation from one another; then, the centroid (i.e. centre of gravity) is derived and linked to the maritime grid.
Preliminary results
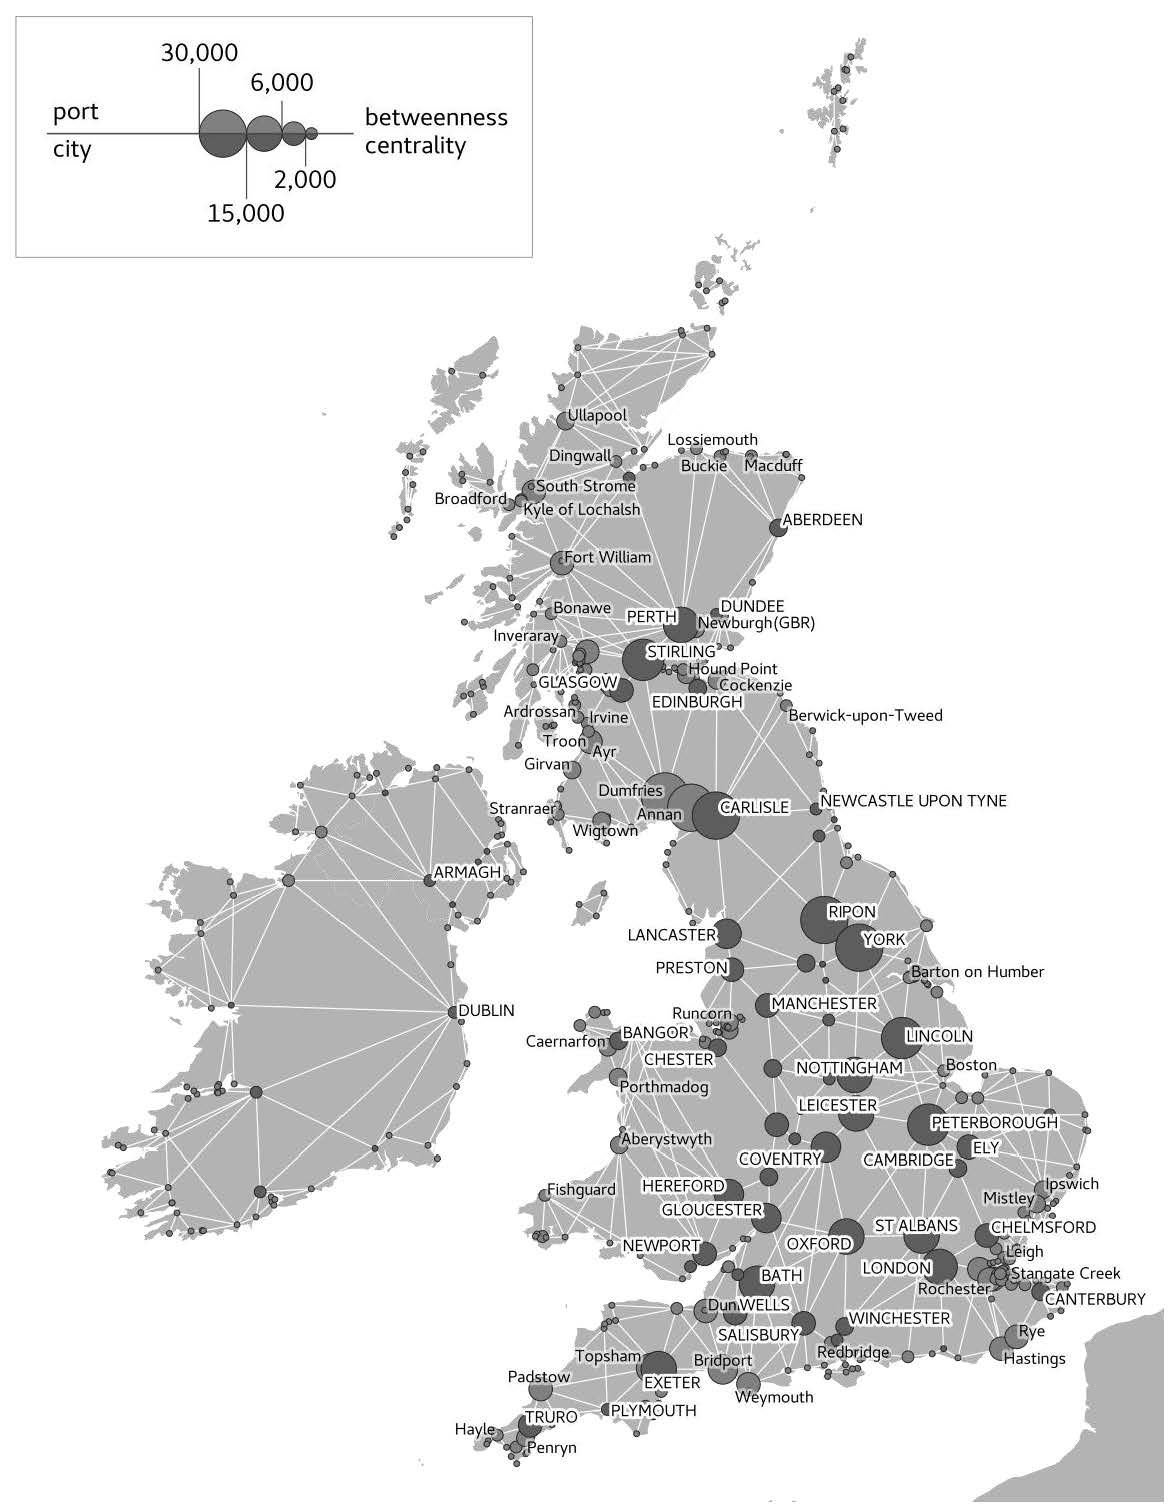
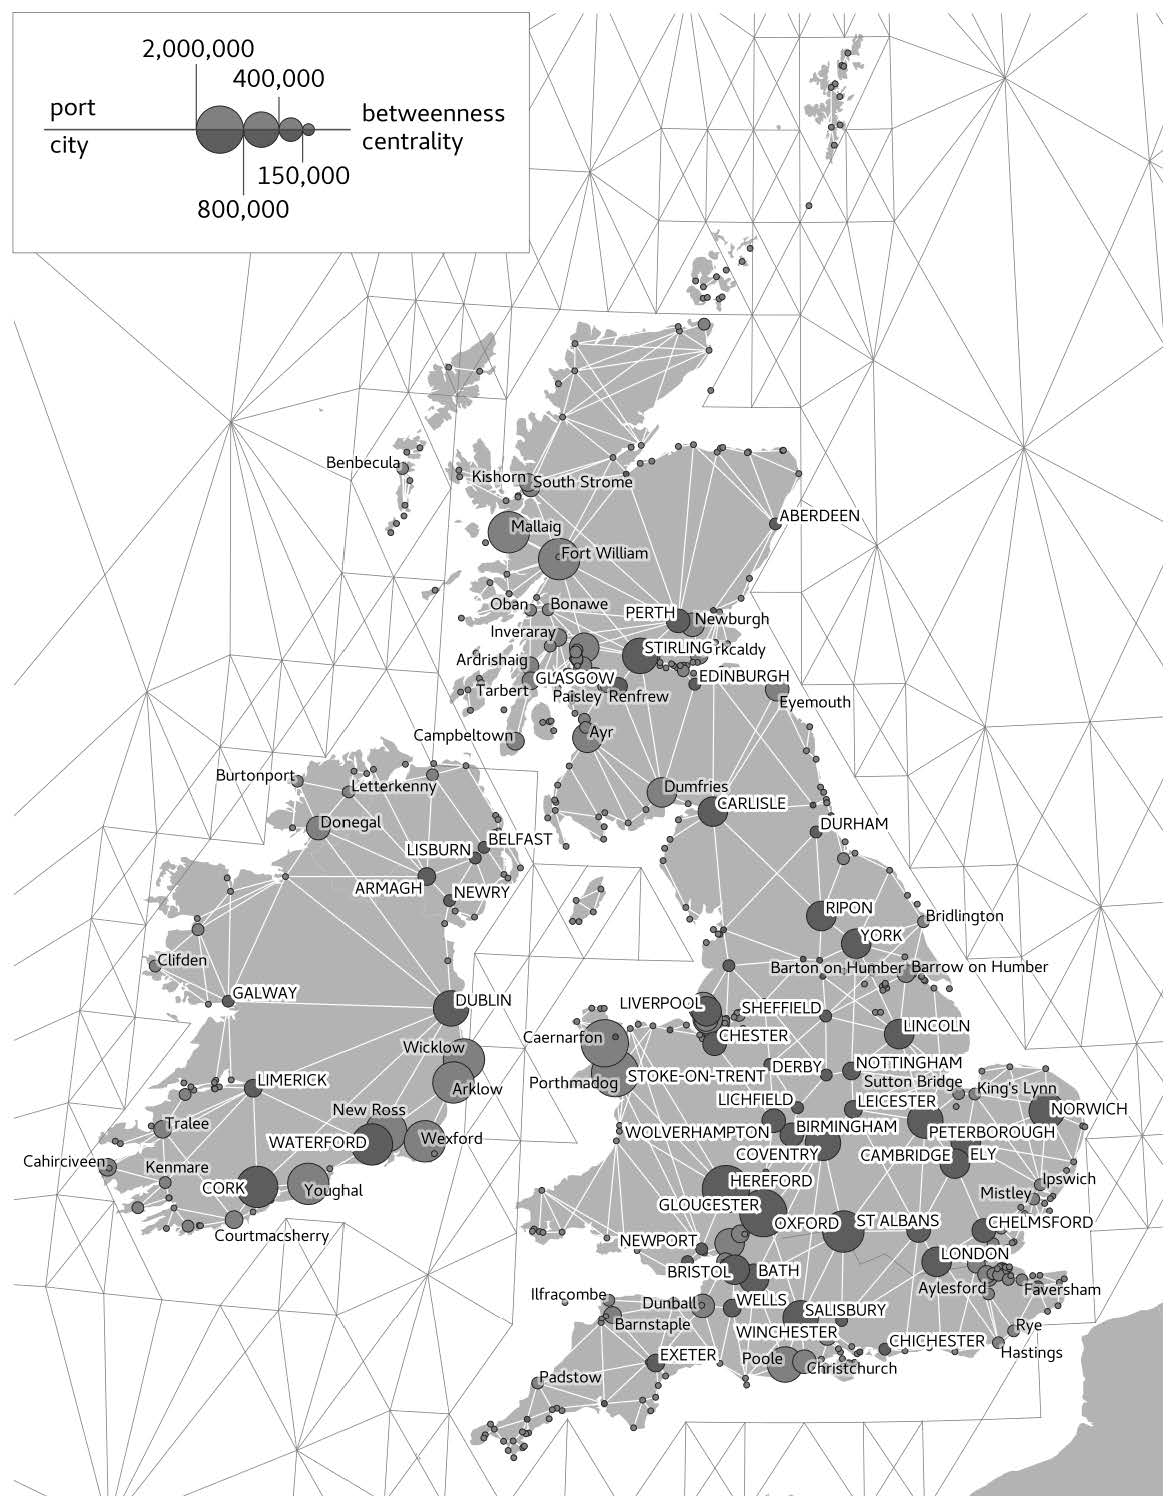
Now that the combined network is fully functional, it is possible to compute accessibility and/or centrality indicators for all networks nodes, such as betweenness centrality, one of the most common, defined by the number of occurrences on shortest paths. The higher the value, the more central the city/port in the road (Figure 3) and land-sea network (Figure 4). The case of UK and Ireland is interesting due to its insularity (without taking account the Channel Tunnel), and because several works have already discussed how to counter peripherality and concentration across this port system (Wilmsmeier and Monios, 2013), following a series of key articles about the shift of main ports and exports towards the Southeast region (Hoare, 1986; Overman and Winters, 2005) notably due to improved inland transport systems and proximity to major trunk shipping lines. Yet, this study is still at its experimental stage and no actual data is used to compute the shortest paths based on the distribution of real shipping flows. The main goal is to verify what is the effect of combining the maritime network with road network, with the hypothesis that beyond possible cartographic biases induced by our model, this analysis shall reflect gains or losses of centrality that are not random but explained by specific factors.
Results obtained from the sole road network (Figure 3) confer paramount importance to inland, non-port cities, but also to coastal cities not being large ports, such as Perth, Stirling, Lancaster, Preston, and Exeter. Top ranked places in the UK road network often locate in the middle of the country, including Carlisle, York, Lincoln, Nottingham, Leicester, Coventry, Peterborough, Oxford, Bath, and St. Albans. London, UK’s main port in total tonnage, is currently reinvesting its port function through the recent development of the London Gateway container terminal by Dubai World Ports. Other places exhibit medium-sized or small centrality, most of them along the coastline – at the periphery of the “central places”. Ireland as a whole is a poorly connected island in comparison, given its smaller size in terms of nodes and links.
A drastically different picture is obtained when calculating centrality on the basis of the combined land-sea network, but without attributing (yet) specific shipping flow data to the maritime grid. Our results are thus relatively abstract in a sense that they indicate which place would benefit or not from being land-sea gateways or hubs in this region (Figure 4). The most striking change is the spectacular centrality growth of places that were relatively remotely located and even “landlocked” in the previous figure. Ireland as a whole (north and south) greatly benefitted from being connected to the shipping network, with Dublin, the capital city of Ireland that was already in a dominant position in the sole road network, became one of the main gateways of the country, followed by mainly southern places that are also the country’s main ports after Dublin: Cork, Waterford, Youghal, Wexford, New Ross, Arklow, and Wicklow. This “southern rise” is directly related to the passage of shortest and optimal shipping routes across the Atlantic towards the English Channel and the Benelux, which deprived Liverpool from its glorious past.
Most interesting are the gains or losses in UK itself as it is not randomly distributed across space. For instance, south-western places in Devon and Cornwall did not benefit from being connected to shipping networks, principally because this region remains peripheral in relation with main trunk lines, and does not possess any large port, with the exception of Exeter and Dunball but overall the whole region became even more peripheral. The opposite phenomenon occurred in Wales with Porthmadog and Caernarfon becoming very central, as a palliation to their landside peripherality, but despite their still low shipping connectivity, also to be seen in the central south with Poole and Bournemouth. Thus, connecting the shipping network may have this effect of greatly enlarging the connectivity of certain places although not being major UK ports. Among inland cities, those close to estuaries gained certain advantage, such as Bristol, Gloucester, or cities close to the sea such as Norwich in England, Fort William and Mallaig in Scotland. All these names sound unfamiliar compared with the centennial importance of large port cities such as Glasgow, Liverpool, Edinburgh, Hull, Sunderland, Southampton, etc. This is mainly because this analysis is only at its infant stage and has not yet incorporated “real” maritime flows in the analysis, should it be container flows only or the whole spectrum from bulks to cruise and general cargo. Yet, Liverpool stands out in the land-sea network due to this inheritance currently prolonged through the Liverpool2 project costing GBP £400 million investment. Finally, a last category of place in UK are those that lost centrality despite their waterside location, such as Lancaster, Annan, Aberdeen, and Newport, which do not anymore belong to top UK ports. Actually, the activity of these ports is negatively related to local socio-economic development issues, as those port regions are marked by under-average GDP and GDP per capita, higher unemployment rate, and strong specialization in liquid bulks, like most of Europe’s coastal periphery suffering from industrial decline and shipping slowdown (Ducruet et al., 2015). In comparison, London’s connectivity remains unchanged, being not a port in itself but a set of estuarial terminals from the “city” to deep-water sites (e.g. Felixstowe) as in the Anyport model (Bird, 1963).
Another way to test our results is to calculate the power-law correlation between road centrality and land-sea centrality; such values being insignificant for non-urban ports (0.084), and moderately significant for ports and cities (0.1487), and for cities alone (0.1944). A quick test with urban population revealed zero correlation with betweenness centrality, whatever the network or type of place considered (0.0002). This is rather counter-intuitive given our initial expectation that land-sea combination, in an island region context, inevitably provide close relationships between urban and port systems. From this lesson we can learn that countries do not exist in isolation from each other; the proximity and dependence from the main hub of Rotterdam is in place and its authority is not going to give it up easily in the coming decades.
The relationship between centrality, urban population, and port traffic
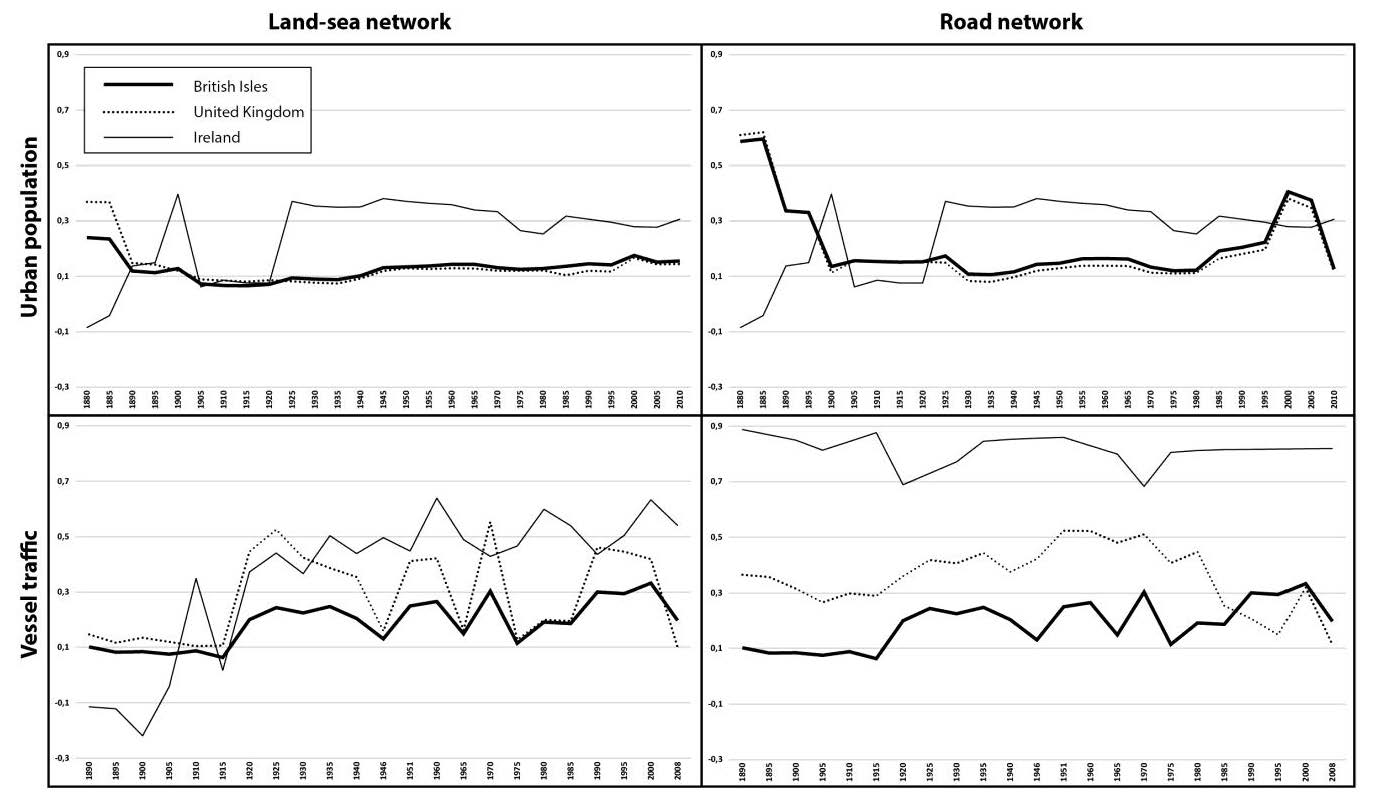
Benefitting from historical data about urban population (i.e. number of inhabitants) and port traffic (i.e. number of vessel calls) since the late nineteenth century (see Ducruet et al., 2018 for a methodological explanation), we run a last test to check whether our nearly a-temporal analysis of network centralities can match those time-series based on simple correlations (Figure 4). The figure compares how betweenness centrality correlates with urban population and vessel traffic of cities and ports. It is an interesting research pathway because although our network model is a-temporal, it carries more elements from the present time (OSM street map and current maritime streams). The correlation in the land-sea network is always lower than in the road network alone, which is already a result in itself. In an island country, the national road network is less complex than the global, modelled maritime network, so that there is a lower probability for urban and port activities to be explained by multimodal rather than simpler land-based network factors, contrary to Europe and the “blue banana”, core-periphery or megalopolis effect (Chapelon, 2006).
Correlation with urban population is absolutely not significant in the land-sea network and this has been the case all over the period (1880-2010) and whatever the territory under study. Although a similar trend is visible for vessel traffic for the British Isles, Ireland, a small country with a relatively simple and small port system, does exhibit a growing correlation with land-sea betweenness centrality, from -0.1 in 1880 to over 0.6 in the 2000s. The United Kingdom has been more irregular given the ampler shifts of maritime activity across the country during that period, but there is no clear trend of decorrelation although this would have been expectable – its remains relatively insignificant around 0.3 on average.
Despite a similar trend in the single / road network for urban population, the results for vessel traffic are remarkably distinct from the rest of the figure. It means that our model has capture a stable effect of the road network topology or morphology on the distribution of vessel traffic. Although the British Isles remain insignificant as a whole, the United Kingdom witnessed a growing correlation (up to over 0.5) until the 1980s, from port-city separation processes became regular in the country, following the model of the London Docklands. Ireland clearly stands out with a correlation of no less than 0.8 on average, meaning that road network configuration and port activities have remains very much tied overtime, which confirms the growing correlation in the intermodal network.
Conclusion
This contribution to urban studies, port studies, and wider (transport, network, cartography) studies can be considered as an initiation to original methods developed in the framework of the ERC World Seastems project where land-sea interactions are envisaged through urban theory, network science, and road transport modelling perspectives [3]. This first step towards a global analysis of such interactions belongs to the buoyant field of multiplex and multilayer networks, provides concrete albeit still abstract measurement of single versus intermodal connectivity, with the potential to deepen up our understanding on wider land-sea interactions, where physical as well as human geography play a central role besides complementary economic and governance issues.
In terms of further upstream developments, this workflow has been deployed on Great Britain and the amount of manual corrections is quite manageable, it does bode well for the future, when the whole globe will be processed. Further research shall refine this coarse definition of cities and ports by using Global Human Settlements (GHS) datasets to build their extent. The use of buffers is, at the moment, just a mean to carry on the development of the automated creation of the spatial graph. Another objective is to observe the evolution of the land-sea network overtime based on real vessel traffic data and older digital versions of worldwide road networks, such as VMAP-0 (1980s to 2000s) or printed maps to go further back in time. As demonstrated by Marnot (2005) in the case of 19th century French and European ports, port competition had long been driven by intermodal facilitation. We thus wish to expand the analysis to the whole Europe and to the world, and add more “flesh to the bones” by integrating traffic data into the maritime grid.
Acknowledgements
The research leading to these results has received funding from the European Research Council under the European Union’s Seventh Framework Programme (FP/2007-2013) / ERC Grant Agreement n. [313847] “World Seastems”.
Notes
[1] https://msp-platform.eu/faq/land-sea-interactions-msp
[2] https://www.openstreetmap.org/#map=6/46.449/2.210
[3] www.world-seastems.cnrs.fr
References
Bird J. (1963) The Major Seaports of the United Kingdom. London: Hutchinson.
Bottasso A., Conti M., de Sa Porto P.C., Ferrari C., Tei A. (2018) Port infrastructures and trade: Empirical evidence from Brazil. Transportation Research Part A: Policy and Practice, 107: 126-139.
Bretagnolle A. (2015) City systems and maritime transport in the long term. In: Ducruet C. (Ed.), Maritime Networks: Spatial Structures and Time Dynamics, Routledge Studies in Transport Analysis, Routledge: London and New York, pp. 27-36.
Bunel M., Bahoken F., Ducruet C., Lagesse C., Marnot B., Mermet E., Petit S. (2017) Geovisualizing the sail-tosteam transition through vessel movement data. In: Ducruet C. (Ed.) Advances in Shipping Data Analysis and Modeling. Tracking and Mapping Maritime Flows in the Age of Big Data, Routledge Studies in Transport Analysis, Routledge: London & New York, pp. 189-205.
Chapelon L. (2006) L’accessibilité, marqueur des inégalités de rayonnement des villes portuaires en Europe. Cybergeo: European Journal of Geography, 345: https://cybergeo.revues.org/2463
Ducruet C. (2016) La spatialité des réseaux maritimes. Contributions maritimes à l’analyse de réseau en géographie. HDR Thesis, University of Paris I Panthéon-Sorbonne.
Ducruet C., Berli J. (2018) Mapping the globe. The patterns of mega-ships. Port Technology International, 77: 94-96.
Ducruet C., Bunel M. (2017a) GeoSeastems: An innovative tool to map global shipping flows. Application to the Mediterranean region. Portus Online, 33: https://portusonline.org/en/geoseastems-an-innovative-tool-to-map-global-shipping-flows-application-to-the-mediterranean-region/#
Ducruet C., Bunel M. (2017b) Le transport maritime et les ports. In: L’océan à découvert, Paris: CNRS Editions, pp. 136-137.
Ducruet C., Cuyala S., El Hosni A. (2018) Maritime networks as systems of cities: The long-term interdependencies between global shipping flows and urban development (1890-2010). Journal of Transport Geography, 66: 340-355.
Ducruet C., Itoh H., Joly O. (2015) Ports and the local embedding of commodity flows. Papers in Regional Science, 94(3): 607-627.
Franc P., Van der Horst M.R. (2010) Analyzing hinterland service integration by shipping lines and terminal operators in the Hamburg-Le Havre range. Journal of Transport Geography, 18(4): 557-566.
Guerrero D., Gonzalez-Laxe F.I., Freire-Seoane M.J., Pais Montes C. (2017) Foreland mix and inland accessibility of European NUTS-3 regions. In: Ducruet (Ed.), Advances in Shipping Data Analysis and Modeling. Tracking and Mapping Maritime Flows in the Age of Big Data, London and New York: Routledge Studies in Transport Analysis, pp. 207-229.
Halim R.A., Kwakkel J.H., Tavasszy L.A. (2015) The impact of the emergence of direct shipping lines on port flows. In: Ducruet C. (Ed.), Maritime Networks. Spatial Structures and Time Dynamics, Routledge Studies in Transport Analysis, Routledge: London and New York, pp. 265-284.
Hoare A.G. (1986) British ports and their export hinterlands: A rapidly changing geography. Geografiska Annaler B, 68(1): 29-40.
Marnot B. (2005) Interconnexion et reclassements: l’insertion des ports français dans la chaîne multimodale au XIXe siècle. Flux, 59(1): 10-21.
Nelson A. (2008) Travel time to major cities: A global map of accessibility. Global Environment Monitoring Unit, Joint Research Centre of the European Commission, Ispra, Italy (online).
Notteboom T.E., Parola F., Satta G., Pallis A.A. (2017) The relationship between port choice and terminal involvement of alliance members in container shipping. Journal of Transport Geography, 64: 168-173.
Notteboom T.E., Rodrigue J.P. (2005) Port regionalization: Towards a new phase in port development. Maritime Policy and Management, 32(3): 297-313.
Overman H.G., Winters L.A. (2005) The port geography of UK international trade. Environment and Planning A, 37(10): 1751-1768.
Pearson N.M. (1985) Littoral society: The case for the coast. The Great Circle, 7(1): 1-8.
Rimmer P.J. (1967) The search for spatial regularities in the development of Australian seaports 1861–1961/2. Geografiska Annaler B, 49(1): 42-54.
Robinson R. (2002) Ports as elements in value-driven chain systems: the new paradigm. Maritime Policy and Management, 29(3): 241-255.
Roso V., Woxenius J., Lumsden K. (2009) The dry port concept: Connecting container seaports with the hinterland. Journal of Transport Geography, 17(5): 338-345.
Slack B. (1985) Containerisation, inter-port competition and port selection. Maritime Policy and Management, 12(4): 293-303.
Torbianelli V.A. (2010) When the road controls the sea: a case study of Ro-Ro transport in the Mediterranean. Maritime Policy and Management, 27(4): 375-389.
Van Klink, H.A. (1998) The port network as a new stage in port development: The case of Rotterdam. Environment and Planning A, 30(1): 143-160.
Van Klink H.A., Van den Berg G.C. (1998) Gateways and intermodalism. Journal of Transport Geography, 6(1): 1-9.
Vigarié A. (1979) Ports de commerce et vie littorale. Paris: Hachette.
Wang L., Zhu Y., Ducruet C., Bunel M., Lau Y.Y. (2018) From hierarchy to networking: The evolution of the ’21st century Maritime Silk Road’ container shipping system. Transport Reviews, DOI:10.1080/01441647.2018.1441923
Wilmsmeier G., Monios J. (2013) Counterbalancing peripherality and concentration: An analysis of the UK container port system. Maritime Policy and Management, 40(2): 116-132.
Head Image: The logos of project (the first on the left) and supporting bodies.