This article was prepared within the framework of the technical cooperation project between the Brazilian government and UNESCO, entitled Pact for Sustainable Suape, which aims to develop and consolidate a policy of social, environmental, educational and cultural responsibility for Suape and its direct area of influence. Different sources were used which included scientific and technical bibliography, statistical data and projections, cartography and geographic information, legislation and applicable regulations. Field visits were held, as well as meetings with Suape Directorates, institutions on the ground and leaders of local communities. Port/City/Industry relations were framed in the spatial and functional context of Suape, analyzing the contrast between the local reality and the wealth generated by these facilities.
Port, city and industry relations
The presence of ports has raised concerns about environmental quality in their surroundings. This was the reality, in most cases, in the past, but at present the attitude has changed, especially regarding ports that have undergone investments and modernization interventions (Pinho, Malafaya and Batista, 2002). As Merk (2013) points out, today economic transformations have led to an understanding that the processes of economic development in the city and in the port are increasingly seen as less interdependent. However, Alemany (2011, p.72) states that “port activity has a major impact on its urban environment.” Hoyle (2011) also mentions that in spite of the existence or not of physical proximity between port and city, their interactions will always condition development in the area in what concerns infrastructure, land use, economic activities and employment structure.
It is also a fact that ports face more challenges regarding their environmental and social responsibility. According to Hall (2007, 87), “seaports also have the potential to be important components of the shift towards urban sustainability.” Indeed, some efforts have been made to address some of these impacts. In 2007 the European Commission adopted a Communication on European Ports Policy and in 2010 the European Organization of Seaports (ESPO) published the Code of Practice on “Societal” Integration of Ports (ESPO, 2010).
The truth is that the positive impacts of port activity are broader in terms of their territorial scale, while the negative impacts are generally felt locally. Negative impacts such as air emissions, water quality, soil, waste production, biodiversity, noise and others are felt locally and are generally heavier for the lower income population, producing an ambiguous relationship between the port and the city.
Suape: the port and industrial facilities
The Suape Port Complex covers an area of 13,500 hectares in the municipalities of Ipojuca and Cabo de Santo Agostinho, in the Metropolitan Region of Recife (RMR) in the State of Pernambuco (see image). The municipalities in which it operates have developed their Master Plans, but there is a fragile institutional capacity to exercise control and planning in terms of the groth within their territories (Suape, 2012).
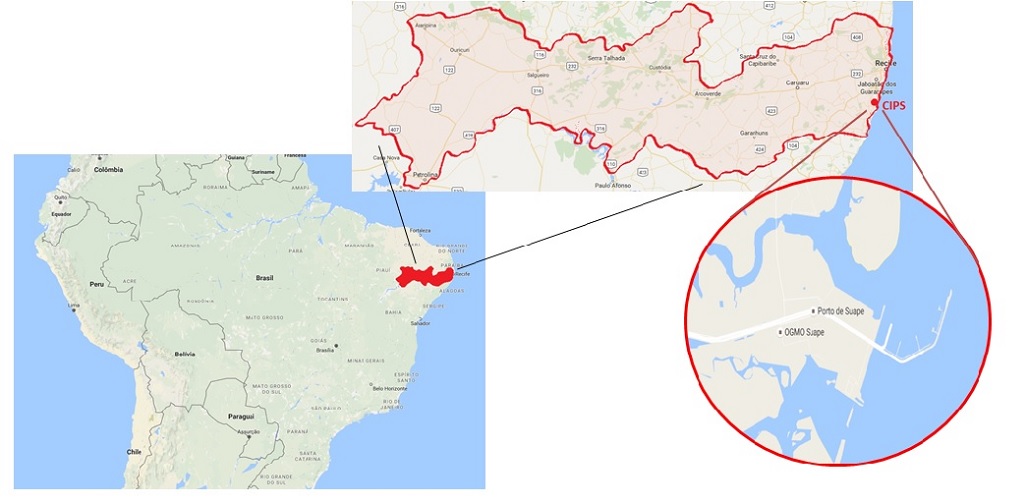
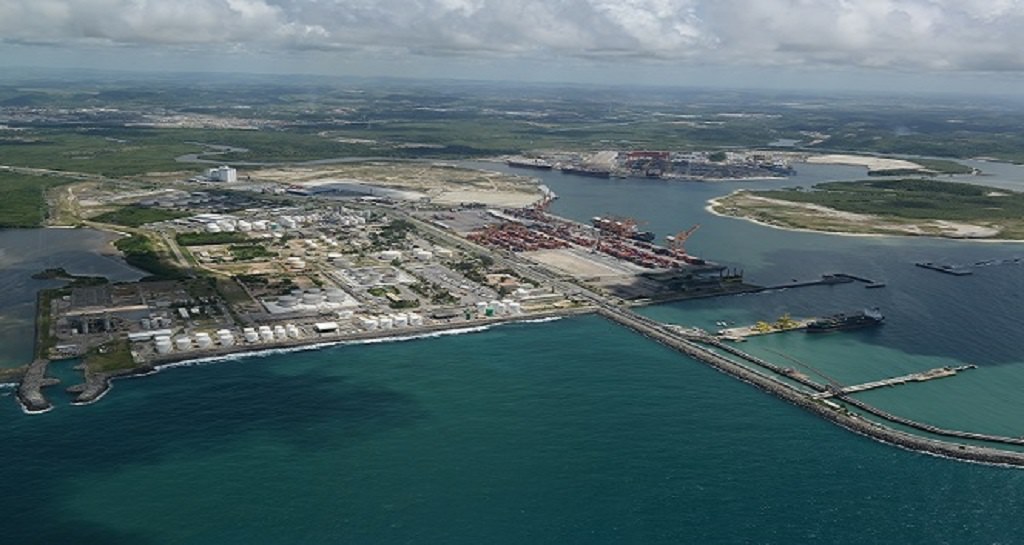
From the 1960s, studies were carried out on the feasibility of setting up a large port on the site, seeking to take advantage of natural conditions of excellence. In spite of all the controversy, in 1978 the Suape Industrial and Port Complex (CIPS) was created (see image). The main arguments were related to the need to decongest the Port of Recife and its surrounding urban fabric. Strategically, the port of Suape is connected to more than 160 ports on all continents (Suape, 2015). As far as the port infrastructure is concerned, the port has a backport area in addition to the external (14/18 meters to be extended to 20 meters) and internal ports (15.5 meters) (Suape, 2015; 2016), where movements include general cargo, containers, with the intention of converting one of the terminals for the disembarkation of vehicles, and liquid bulk cargoes highlighting the terminals that allow the docking of oil tankers up to 170 thousand TPB (Suape, 2015, 2016). Regarding safety and environmental protection, Suape regularly promotes a set of Environmental Monitoring and Control Programs (Suape, 2015).
The new Suape 2030 Master Plan (2011) divides its area of influence into Direct Influence Area 1 (municipalities in which the Port is inserted), Area of Direct Influence 2 (surrounding municipalities and on which the activities of the Complex exercise Relative interference), and Area of Indirect Influence (states near Pernambuco) (Suape, 2011). CIPS is divided into different zones: the Industrial and Port Area (14%), the Industrial zone (22%), the Central Administrative and Services Area (3%), the Ecological Preservation zone (59%) and the zone of Cultural Preservation (2%) (Suape, 2015).
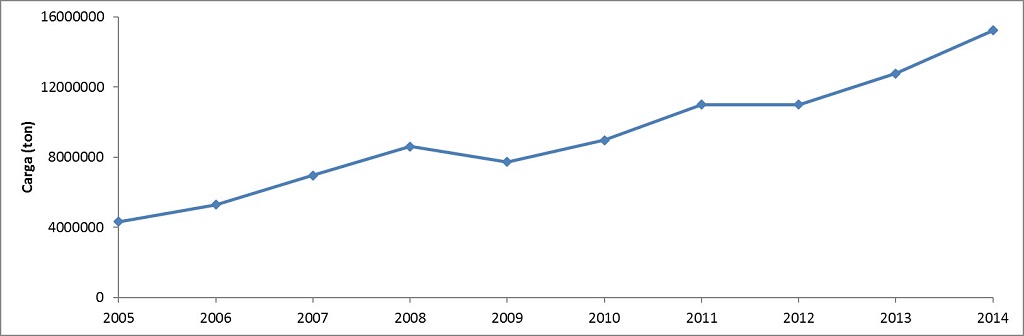
The port and industrial complex has around 100 entreprises (more than 25 thousand direct jobs), and another 50 are in the implementation phase, covering sectors ranging from the chemical and metal-mechanic industry, the naval industry and logistics, to energy generation poles, liquid bulk and gases, the food industry or textiles (Suape, 2015). Port movement has been increasing at an accelerated pace (see table). 4.3 million tons of cargo were moved in 2005, almost 9 million tons in 2010 and more than 15 million tons in 2014 (ADDIPER, 2015).
Contrasts: generated wealth and local reality
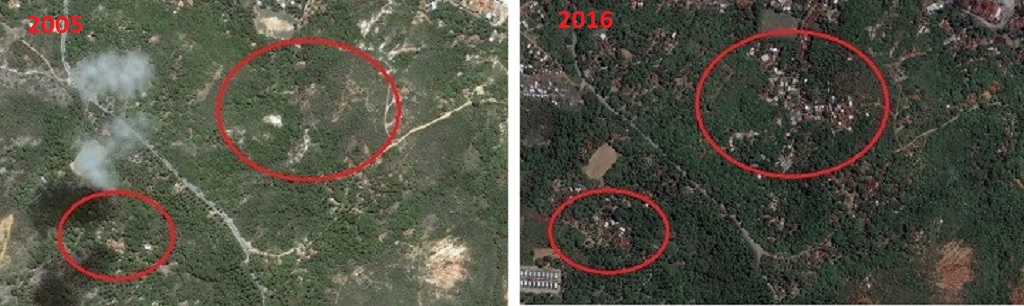
The territory where the CIPS is inserted was the object of a strong migratory flow given the job offer created from the 60’s on. It is a territory characterized by an unplanned urbanization process, due to invasions and irregular subdivisions: in Cabo de Santo Agostinho, 59% of dwellings in 2010 corresponded to favelas (IBGE, 2010). The demographic pressure is significant, causing strong impacts on the density of land occupation (see image). In the Cape, population density increased from 342.2 inhab/km2 in 2000 to 413 inhab/km2 in 2010. Compared to 1980 it almost doubled. In Ipojuca, the values for demographic densities were 112.5 inhab/km2 in 2000 and 153.0 inhab/km2 in 2010 (IBGE, 2010).
In terms of education and training, in Cabo, only 2.7% of the population has a university degree, more than 54% of the population did not complete primary education, and almost 1% did not have any education (IBGE, 2010). These numbers reveal a population with a very low level of education. For this reason, in terms of employment, the situation at local level did not change significantly since the population did not have the necessary qualification for employment generated by the Industrial District and the Suape Complex, remaining in low-skilled and usually low-income jobs. The labor force required for the development process was “imported” from other municipalities (Suape, 2012).
Regarding the impacts of the projects located in Suape, the total value of the production almost quadrupled between 2009 and 2016. If the planned investments in the enterprises and corresponding production growth are verified, the Gross Value of Production (VBP) should grow 78.3% in seven years up to R$33 billion in 2016, the Value Added (VA) will grow 60.4% up to R$15.4 billion in 2016 (Suape, 2012). Regarding the municipal revenue, there will be a growth of municipal collection that almost doubles in seven years (Suape, 2012). However, this fact does not reflect in an improvement of the population quality of life.
With regard to jobs at CIPS, these were 33,139 and an estimated 47,233 jobs are expected in 2016, an increase of 42.5% (Suape, 2012). In municipalities, the number will increase from 106,996 in 2009 to 164,190 in 2016, representing a growth of 53.4% (2.8% of the state’s labor market). Regarding the salary mass, this will increase by 72.5% between 2009 and 2016 (7.9% per year) (Suape, 2012). The municipalities represent 10.6% of the Pernambuco wage mass estimated at R$38.2 billion (Suape, 2012).
However, according to IBGE (2013), the average monthly nominal income of people with 10 years or more with economically active income in Cabo, was R$1,106.42, in Ipojuca R$857.5 and in Recife R$2,073.18. These figures contrast with the values recorded for the GDP per capita in these municipalities (2013, at current prices) where Ipojuca has a GDP per capita of R$95,666.34, Cabo R$37,530.14 and Recife only R$29,037.18. The municipalities with the highest GDP and that create greater wealth do not see this wealth mirrored in the average income of their population.
With regard to urban infrastructure data, the housing deficit accumulated in 2010 is 97.5% in the monthly household income range up to 3 minimum wages. The number of housing required in this group in 2030 (probable basic housing deficit) rises to 10,600 dwellings (Suape, 2012). With regard to water supply by official system, considering the projected evolution of the population in the two municipalities, about 186 km of new distribution network will be needed (Suape, 2012). Regarding the sewage system, the problem is even more serious. Overall, adding the 2012 deficit to the expected demand by 2030 it will require 86,812 connections to the sewerage network (Suape, 2012). In the solid waste sector, there are deficits in the provision of urban cleaning services, in the final disposal of dumps, in the dispersed and uncontrolled disposal of waste, which will aggravate due to the population densification, increase in income and intensifying of activities in the municipalities and in the complex. The volume increase in 2030, compared to 2010, will be 28% (Suape, 2012).
Final considerations
The challenge for the future relationship between the port of Suape and its surrounding territory will be the deepening of the social component for a more cohesive and inclusive development. The GDP associated with this complex and the number of associated jobs represent a strong wealth generated by the complex that should translate into an effective improvement of the living conditions of the population. The port strategy will increasingly have to invest in a sustainable relationship between port development, urbanization, the preservation of the region’s natural and cultural values and, finally, to strengthen the development of local communities, integrating them with the benefits obtained through Port growth. From the analysis carried out, it was decided in future works to deepen the knowledge of the Metropolitan Park Armando de Holanda Cavalcanti, integrated in Suape, in order to advance with proposals and a pilot project in terms of the model of territorial management and that will be the object of future articles.
References
ADDIPER (2015) Complexo Industrial Portuário de Suape. Pernambuco preparado para grandes negócios, Agência de Desenvolvimento Econômico de Pernambuco, Recife, PE. Disponível em https://pt.slideshare.net/ADDiper/apresentao-suape-2015. Acessado em 11/07/2016.
Alemany, J. (2011), Ports in the Urban Economy, in The Port City of the XXIst Century, RETE, Venice. Italy, (p.72-86). ISBN 978-88-906509-01.
Condepe-Fidem (s.d.) Pernambuco em mapas. Disponível em: https://www.condepefidem.pe.gov.br/html/PERNAMBUCO%20EM%20MAPAS.pdf#page=47&zoom=100,-7,918. Acesso em 14/03/2015.
ESPO (2010) Code of practice on Societal Integration of Ports, European Sea Ports Organisation, Brussels.
Hall P. V. (2007) Seaports, Urban Sustainability, and Paradigm Shift, Journal of Urban Technology, 14:2, 87-101. DOI: 10.1080/10630730701531757. https://dx.doi.org/10.1080/10630730701531757. Accessed 27/01/2015.
Hesse, M. (2010), Cities, material flows and the geography of spatial interaction: urban places in the system of chains, in Global Networks 10, 1, (p.75–91), ISSN 1470–2266.
Hoyle, B. (2011), Tomorrow’s World? Divergence and Reconvergence at the Port-City Interface, in The Port City of the XXIst Century, RETE, Venice. Italy, (p.14-29). ISBN 978-88-906509-01.
IBGE (2010) Censos 2010. Brasília: Instituto Brasileiro de Geografia e Estatística.
Lei Estadual Nº 7.763, de 07 de novembro de 1978. Criação da empresa SUAPE – Complexo Industrial Portuário.
Malafaya, F. (2007) O conteúdo ambiental dos instrumentos locais de planeamento do território, uma visão comparativa no quadro europeu, Tese de Doutoramento, FEUP, Porto.
Malafaya, F.; Batista, L.; Rabanni E.; Silva, S. (2015) Can a (new) port bring hapiness to city people? The case of Suape (Recife-PE), in CITTA 8th Annual Conference, FEUP, Porto.
Merk, O. (2013), The Competitiveness of Global Port-Cities: Synthesis Report, OECD Regional Development Working Papers, 2013/13, OECD Publishing. https://dx.doi.org/10.1787/5k40hdhp6t8s-en. Acessado em 27/01/2015.
Pinho, P., Malafaya F., Batista, L. (2013) The changing interactions between cities and ports, in 6th International Conference CITTA, FEUP/FCTUC, Porto.
Pinho, P., Malafaya F., Batista, L. (2002) Urban Planning and Port Management: the changing nature of city-port interactions, in Congresso Littoral 2002, FEUP, Porto.
Suape (2016) Reuniões com Diretorias de Suape, Cabo de Santo Agostinho, PE.
Suape, (2015) Complexo de Suape – O polo de desenvolvimento mais dinâmico do Brasil. https://www.suape.pe.gov.br/institutional/institutional.php. acessado em março de 2105 e junho de 2016.
Suape (2012) Suape sustentável, Consórcio Diagonal Urbana/CEPLAN, PE, Brasil.
Suape (2011) Plano Diretor Suape 2030, publicado na última versão na Lei 37.160 de 23/9/2011
Verhoeven, P. (2011), Societal integration of ports: a key task for Port Auhorites, in The Port City of the XXIst Century, RETE, Venice. Italy, (p.186-200). ISBN 978-88-906509-01.
Verhoeven, P. (2009) European ports policy: meeting contemporary governance challenges, Maritime Policy & Management: The flagship journal of international shipping and port research, 36:1, 79-101, DOI: 10.1080/03088830802652320.
Head image: Suape and its surrounding territory. (Source: Suape, 2016)
Suape/Brasil: impactos no perfil sócio económico na envolvente do complexo industrial e portuário
Este artigo foi elaborado no âmbito do projeto de cooperação técnica entre o governo brasileiro e a UNESCO, intitulado Pacto por Suape Sustentável, que pretende desenvolver e consolidar uma política de responsabilidade social, ambiental, educacional e cultural para Suape e sua área de influência direta. Recorreu-se a fontes que incluíram bibliografia científica e técnica, dados e projeções estatísticas, cartografia e informação geográfica, legislação e regulamentação aplicável. Foram realizadas visitas de campo, reuniões com Diretorias de Suape, com instituições no terreno e com representantes das comunidades locais. Procedeu-se ao enquadramento das relações Porto/Cidade/Indústria, ao contexto espacial e funcional de Suape, analisando o contraste entre a realidade local e a riqueza gerada por este complexo.
Relação cidade porto indústria
A presença dos portos tem causado preocupações sobre questões de qualidade ambiental nas suas envolvente. Esta era a realidade, na maioria dos casos, no passado, mas no presente a atitude mudou, principalmente no que diz respeito aos portos que sofreram investimentos e intervenções de modernização (Pinho, Malafaya e Batista, 2002). Como refere Merk (2013), hoje as transformações económicas levaram a que os processos de desenvolvimento económico da cidade e do porto sejam cada vez menos vistos como interdependentes. No entanto, Alemany (2011, p.72) refere que “a atividade portuária tem um grande impacto no seu entorno urbano”. Segundo Hoyle (2011), existindo ou não uma proximidade física porto cidade, as suas interações irão sempre condicionar o desenvolvimento na área ao nível das infraestruturas, do uso do solo, das atividades económicas e da estrutura do emprego.
É também um facto que os portos enfrentam mais desafios no que diz respeito à sua responsabilidade ambiental e social. Segundo Hall (2007, 87), “os portos marítimos também têm o potencial para serem componentes importantes da mudança para a sustentabilidade urbana”. Na verdade, verificaram-se alguns esforços na resolução de alguns destes impactos. Em 2007 a Comissão Europeia adotou uma comunicação sobre a política portuária europeia e em 2010 a Organização Europeia de Portos Marítimos (ESPO) publicou o Código de Prática sobre integração “societal” dos portos (ESPO, 2010).
A verdade é que os impactos positivos da atividade portuária são mais amplos em termos da sua escala territorial, enquanto os negativos são geralmente sentidos localmente. Os impactos negativos como as emissões de ar, qualidade da água, do solo, produção de resíduos, biodiversidade, ruído e outros, são sentidos localmente sendo geralmente mais pesados para a população de menor renda, produzindo uma relação ambígua entre o porto e a cidade.
Suape: o complexo portuário e industrial
O Complexo Portuário de Suape abrange uma área de 13.500 hectares nos municípios de Ipojuca e Cabo de Santo Agostinho, na Região Metropolitana do Recife (RMR) no Estado do Pernambuco (ver a imagem). Os municípios onde se insere desenvolveram os seus Planos Diretores verificando-se, no entanto, uma frágil capacidade institucional para exercerem controlo e planeamento no que se refere à expansão dentro dos seus territórios (Suape, 2012).
Localização de Suape. (Adaptado de GoogleEarth, 2016)
A partir da década de 1960 foram desenvolvidos estudos relativos à viabilidade de implantação de um grande porto no local, procurando tirar partido de condições naturais de excelência. Apesar de toda a controvérsia, em 1978 foi criado o Complexo Industrial e Portuário Suape (CIPS) (ver a imagem). Os principais argumentos prenderam-se com a necessidade de descongestionar o Porto do Recife e o tecido urbano envolvente. Estrategicamente, o porto de Suape está ligado a mais de 160 portos em todos os continentes (Suape, 2015). No que diz respeito à estrutura portuária o porto possui uma área de retroporto para além dos portos externo (14/18 metros a estender aos 20 metros) e interno (15,5 metros) (Suape, 2015; 2016), onde se movimentam carga geral, contentores, com intenção de converter um dos terminais para o desembarque de veículos, e granéis líquidos com destaque para os terminais que permitem a atracagem de petroleiros até 170 mil TPB (Suape,2015; 2016). Em termos de segurança e proteção ambiental, Suape promove regularmente um conjunto de Programas de Monitoramento e Controle Ambiental (Suape, 2015).
Complexo Industrial e Portuário de Suape. (Fonte: Suape, 2016)
O novo Plano Diretor Suape 2030 (2011), divide a sua área de influência em Área de Influência Direta 1 (municípios nos quais o Porto está inserida), Área de Influência Direta 2 (municípios da envolvente e sobre os quais as atividades do Complexo exercem relativa interferência), e Área de Influência Indireta (Estados próximos a Pernambuco) (Suape, 2011). O CIPS está dividido em zonas distintas: a zona Industrial e Portuária (14%), a zona Industrial (22%), a zona central Administrativa e de Serviços (3%), a zona de Preservação Ecológica (59%) e a zona de Preservação Cultural (2%) (Suape, 2015).
O complexo portuário e industrial tem cerca de 100 empresas (mais de 25 mil empregos diretos), e outras 50 estão em fase de implantação, abrangendo setores que vão desde a indústria de produtos químicos e a metalomecânica, a indústria naval e a logística, até aos polos de geração de energia, aos granéis líquidos e gases, à indústria alimentar ou têxtil (Suape, 2015). A movimentação portuária tem vindo a crescer em ritmo acelerado (ver a table): em 2005 foram movimentadas 4,3 milhões de toneladas de carga, em 2010, foram quase 9 milhões e em 2014 foram mais de 15 milhões (ADDIPER, 2015).
Evolução do movimento anual de cargas no CIPS. (Fonte ADDIPER, 2015)
São inúmeras as ações desenvolvidas no âmbito do programa de sustentabilidade, através do qual Suape desenvolve os Programas Básicos Ambientais (PBAs) e um Programa de Educação Ambiental (PEA), realiza o plantio de mudas nativas da Mata Atlântica e o reflorestamento de áreas degradadas, recolhe e trata os resíduos sólidos. Em 2016 o CIPS ganhou pela primeira vez o Prêmio SuperTop Socioambiental e de RH, na categoria de Meio Ambiente, e a Agência Nacional de Transportes Aquaviários (Antaq) avaliou Suape no Índice de Desempenho Ambiental Portuário (IDA), passando para a quarta posição (Suape, 2015; 2016).
Contrastes: riqueza gerada e realidade local
O território onde se insere o CIPS foi objeto de um forte fluxo migratório dada a oferta de emprego criada a partir da década de 60. Éum território caraterizado por um processo de urbanização não planeado, por invasões e loteamentos irregulares: no Cabo de Santo Agostinho, 59% das habitações em 2010 correspondiam favelas (IBGE, 20109. A pressão demográfica é significativa tendo provocado fortes impactos na densidade de ocupação dos solos (ver a imagem). No Cabo a densidade demográfica passou de 342,2 hab/km2 em 2000 para 413,9 hab/km2 em 2010. Relativamente a 1980 quase duplicou. Já em Ipojuca os valores registados para as densidades demográficas foram de 112,5 hab/km2 em 2000 e de 153,0 hab/km2 em 2010 (IBGE, 2010).
Urbanização não planeada. Adaptado de GoogleEarth, 2016.
Em termos de educação e formação, no Cabo, apenas 2,7% da população tem curso superior completo e mais de 54% da população não completou o ensino fundamental e destes quase 1% não teve qualquer instrução (IBGE, 2010), o que revela uma população com um nível de formação muito baixo. Por este motivo, em termos de emprego, a situação a nível local não se alterou significativamente uma vez que a população não apresentava a qualificação necessária ao emprego gerado pelo Distrito Industrial e pelo Complexo Suape, permanecendo em empregos pouco qualificados e normalmente de baixo rendimento. A mão de obra necessária ao processo de desenvolvimento foi “importada” de outros municípios (Suape, 2012).
No que se refere aos impactos dos empreendimentos localizados em Suape, o valor total da produção quase quadriplicou entre 2009 e 2016. A verificarem-se os investimentos planeados nos empreendimentos e o correspondente crescimento da produção, o Valor Bruto de Produção (VBP) deve crescer 78,3 % em sete anos passando para R$33 bilhões em 2016, o Valor Adicionado (VA) terá um crescimento de 60,4% passando para R$ 15,4 bilhoes em 2016 (Suape, 2012). No que se refere à receita minicipal, haverá um crescimento que quase duplica em sete anos (Suape, 2012). No entanto, este fato não se tem refletido na melhoria da qualidade de vida das populações.
Relativamente aos postos de trabalho no CIPS, estes eram de 33.139 e estima-se em 2016 um número de 47.233 postos, um aumento de 42,5% (Suape, 2012). Nos municípios, o numero crescerá de 106.996 em 2009 para 164.190 em 2016, representando um crescimento de 53,4%, (2,8% do mercado de trabalho do estado). Em relação à massa salarial esta aumentará entre 2009 e 2016 cerca de 72,5% (7,9% ao ano) (Suape, 2012). Os munícípios representam 10,6% da massa de salários de Pernambuco estimada em R$ 38,2 bilhões (Suape, 2012).
No entanto, de acordo com o IBGE (2013), o rendimento nominal médio mensal das pessoas com 10 anos ou mais com rendimento economicamente ativas no Cabo, era de R$1.106,42, em Ipojuca de R$857,5 e no Recife de R$2.073,18. Estes números contrastam com os valores registados para o Produto Interno Bruto (PIB) per capita nesses municípios (2013, a preços correntes) onde Ipojuca apresenta um PIB per capita de R$95.666,34, o Cabo R$37.530,14 e o Recife apenas R$29.037,18. Os municípios com maior PIB e geradores de maior riqueza não vêem esta riqueza espelhada no rendimento médio da sua população.
Relativamente aos dados da infraestrutura urbana, o deficit habitacional acumulado em 2010 insere-se em 97,5% na faixa de rendimento domiciliar mensal até 3 salários mínimos. O número de moradias necessárias neste grupo em 2030 (deficit habitacional básico provável) sobe às 10,6 mil moradias (Suape, 2012). No que se refere ao abastecimento de água por sistema oficial, considerando a evolução projetada da população nos dois municípios, serão necessários cerca de 186 km de rede de distribuição nova (Suape, 2012). Relativamente à rede de esgotos, o problema é mais sério ainda. Em termos de conjunto, juntando o deficit de 2012 com a demanda prevista até 2030 serão necessárias 86.812 ligações à rede de esgoto (Suape, 2012). No setor dos resíduos sólidos são registados déficits no atendimento dos serviços de limpeza urbana, na disposição final em lixões, na disposição dispersa e não controlada de resíduos, que se agravarão com a densificação populacional, com o aumento da renda e com a intensificação das atividades nos municípios e no complexo. O acréscimo de volume em 2030 relativamente a 2010 será de 28% (Suape, 2012).
Considerações finais
O desafio para o futuro relacionamento entre o porto de Suape e o seu território envolvente será o aprofundamento da componente social para um desenvolvimento mais coeso e inclusivo. O PIB associado este complexo e o número de postos de trabalho associados representam uma forte riqueza gerada pelo complexo que deverá traduzir-se numa efetiva melhoria das condições de vida da população. A estratégia do porto terá cada vez mais que investir numa relação sustentável entre o desenvolvimento portuário, a urbanização, a preservação dos valores naturais e culturais da região e, por último, reforçar o desenvolvimento das comunidades locais, integrando-os nos benefícios obtidos através do crescimento do porto. Da análise efetuada optou-se por, em trabalhos futuros, aprofundar o conhecimento do Parque Metropolitano Armando de Holanda Cavalcanti, integrado em Suape, de modo a avançar com propostas e um projeto piloto em termos do modelo de gestão territorial e que serão objeto de artigos futuros.
Referências bibliográficas
ADDIPER (2015) Complexo Industrial Portuário de Suape. Pernambuco preparado para grandes negócios, Agência de Desenvolvimento Econômico de Pernambuco, Recife, PE. Disponível em https://pt.slideshare.net/ADDiper/apresentao-suape-2015. Acessado em 11/07/2016.
Alemany, J. (2011), Ports in the Urban Economy, in The Port City of the XXIst Century, RETE, Venice. Italy, (p.72-86). ISBN 978-88-906509-01.
Condepe-Fidem (s.d.) Pernambuco em mapas. Disponível em:https://www.condepefidem.pe.gov.br/html/PERNAMBUCO%20EM%20MAPAS.pdf#page=47&zoom=100,-7,918. Acesso em 14/03/2015.
ESPO (2010) Code of practice on Societal Integration of Ports, European Sea Ports Organisation, Brussels.
Hall P. V. (2007) Seaports, Urban Sustainability, and Paradigm Shift, Journal of Urban Technology, 14:2, 87-101. DOI: 10.1080/10630730701531757. https://dx.doi.org/10.1080/10630730701531757. Accessed 27/01/2015.
Hesse, M. (2010), Cities, material flows and the geography of spatial interaction: urban places in the system of chains, in Global Networks 10, 1, (p.75–91), ISSN 1470–2266.
Hoyle, B. (2011), Tomorrow’s World? Divergence and Reconvergence at the Port-City Interface, in The Port City of the XXIst Century, RETE, Venice. Italy, (p.14-29). ISBN 978-88-906509-01.
IBGE (2010) Censos 2010. Brasília: Instituto Brasileiro de Geografia e Estatística.
Lei Estadual Nº 7.763, de 07 de novembro de 1978. Criação da empresa SUAPE – Complexo Industrial Portuário.
Malafaya, F. (2007) O conteúdo ambiental dos instrumentos locais de planeamento do território, uma visão comparativa no quadro europeu, Tese de Doutoramento, FEUP, Porto.
Malafaya, F.; Batista, L.; Rabanni E.; Silva, S. (2015) Can a (new) port bring hapiness to city people? The case of Suape (Recife-PE), in CITTA 8th Annual Conference, FEUP, Porto.
Merk, O. (2013), The Competitiveness of Global Port-Cities: Synthesis Report, OECD Regional Development Working Papers, 2013/13, OECD Publishing. https://dx.doi.org/10.1787/5k40hdhp6t8s-en. Acessado em 27/01/2015.
Pinho, P., Malafaya F., Batista, L. (2013) The changing interactions between cities and ports, in 6th International Conference CITTA, FEUP/FCTUC, Porto.
Pinho, P., Malafaya F., Batista, L. (2002) Urban Planning and Port Management: the changing nature of city-port interactions, in Congresso Littoral 2002, FEUP, Porto.
Suape (2016) Reuniões com Diretorias de Suape, Cabo de Santo Agostinho, PE.
Suape, (2015) Complexo de Suape – O polo de desenvolvimento mais dinâmico do Brasil. https://www.suape.pe.gov.br/institutional/institutional.php. acessado em março de 2105 e junho de 2016.
Suape (2012) Suape sustentável, Consórcio Diagonal Urbana/CEPLAN, PE, Brasil.
Suape (2011) Plano Diretor Suape 2030, publicado na última versão na Lei 37.160 de 23/9/2011
Verhoeven, P. (2011), Societal integration of ports: a key task for Port Auhorites, in The Port City of the XXIst Century, RETE, Venice. Italy, (p.186-200). ISBN 978-88-906509-01.
Verhoeven, P. (2009) European ports policy: meeting contemporary governance challenges, Maritime Policy & Management: The flagship journal of international shipping and port research, 36:1, 79-101, DOI: 10.1080/03088830802652320.
Head image: Suape e seu território envolvente. (Fonte: Suape, 2016)