╔
When it comes to represent reality, such as movement of transports, over a map, cartographers face problems of different types. Traditional mapmaking techniques, such as paper maps, are limited by factors such as size, portability, and the ability to update information. Addressing these limitations often requires careful consideration of the specific context and objectives of the representation, as well as the use of techniques such as perspective drawing, scaling, and supplementary annotations to enhance clarity and accuracy. However, digital mapping technologies have helped to overcome some of these constraints but can introduce new challenges related to data storage, processing, and accessibility. Addressing the problems of geographical representation often requires a combination of improved data collection methods, advancements in technology, critical awareness of biases, and ongoing dialogue among cartographers.
To address the issue of depicting transportation networks, such as vessel movements between ports more accurately than simply as straight lines (Ducruet et al., 2021), railway or flight connections between cities, it is necessary to have a global meshing that allows the movement in a realistic way and without problems of representation. This was made achievable through the utilization of a pre-existing maritime grid (Ducruet et Berli, 2018). Such a model enabled the identification of potential enhancements based on the changing routes over time.
For this goal, we have used Grass software, which proved invaluable in tackling the challenge of visualizing three-dimensional features on a two-dimensional surface, as well as in linking the grid across the expanse of the Pacific Ocean. This was particularly crucial given the predominant focus on Europe in most maps that employ the Mercator projection (see Figures 1 and 2).
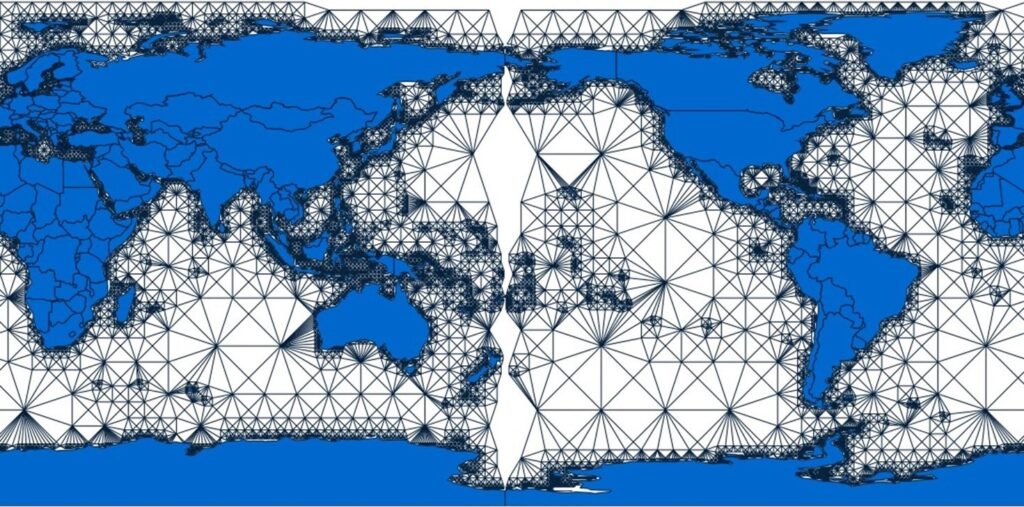
Figure 1. Connection mesh problema. (© Author’s elaboration).
The meshing grid initially encountered issues of incompleteness due to the limitations inherent to conventional map creation methods across various software platforms, which typically represent maps in two-dimensional space rather than three-dimensional. This limitation often leads to distortions or simplifications in the representation, which may obscure or misrepresent certain aspects of the original object or phenomenon.
The utilization of Grass software not only resolved this challenge but also facilitated the integration of the grid across the Pacific Ocean-which was the problematic part, compensating for the Euro-centric bias often observed in maps utilizing the Mercator projection.
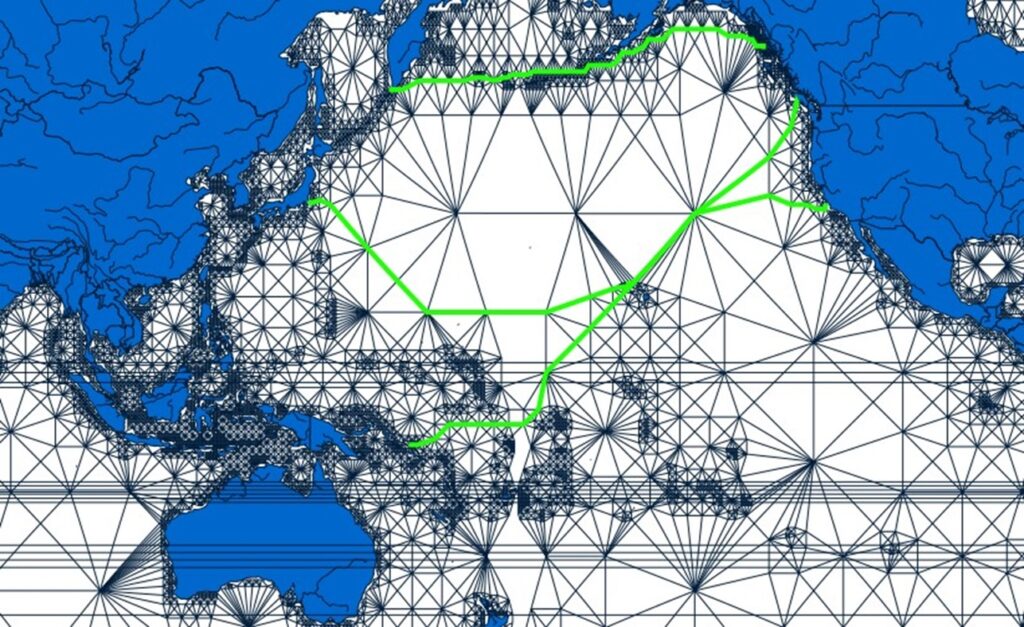
Figure 2. Unconnected mesh problem for routes solved. (© Author’s elaboration).
To enhance the mesh, all port nodes, stations, airports or cities-have been incorporated with a 1.5-degree tolerance to ensure connectivity among island ports, while also optimizing for those along the mainland coast. This configuration enables the study of connectivity, accessibility, and centrality measures within the network. The fundamental components of this spatial system are the urban centers/ports and the interconnecting links between them, represented topologically as nodes and arcs within a graph. Nodes consist usually of ports, stations or airports, encompassing all urban and semi-urban centers within the topological network, while arcs are delineated by the spatial arrangement of ports connecting the various nodes.
To refine the network, distances were measured as costs for each edge, and certain shortest paths deemed unrealistic for maritime transport of goods were disabled. These included specific rivers (such as the Volga, Rhine, and Danube) which act as connection points, the Panama Channel (established in 1914), Suez Channel, the Bosporus, the Dead Sea, and the Arctic region. Since the exported vector of the mesh does not form a continuous loop around the world – having “extremes” where navigation is not feasible – the process was repeated with the inverse vector. For instance, the continent of America was positioned first at one extreme and then at the opposite end to account for this discontinuity.
Once the mesh was established with nodes and edges, centrality measures can be computed using R to gauge the centrality of each node. This metric indicates the varying structural complexity of the network, directly tied to the number of nodes, arcs, and their spatial arrangement (Kansky, 1963). Centrality, accessibility, and connectivity measures facilitate the analysis of the spatial organization of the network, enabling the establishment of a hierarchy among nodes based on their ease of access to other nodes within the graph. Graph theory, social network analysis, and complex networks are the common frameworks to study such topologies in the case of shipping flows (Ducruet, 2023).
The concept of accessibility encompasses various dimensions, and multiple metrics can be employed to assess it. Generally, accessibility is defined as “the sum of the relative opportunities for contact and spatial interaction from the system as a whole” (Calvo Palacios, 1993). However, network topology must be considered in conjunction with other factors such as distance, cost, and time requirements.
In the present case, only distance is considered as a factor determined by the nodes and arcs of the network, without accounting for additional variables, allowing the possibility for adding other attributes in subsequent research. The initial stage of each analysis involved the creation of an accessibility matrix, reflecting topological distances via the shortest paths between graph nodes. Various accessibility measures were derived from this matrix as well.
Regarding the final representation, it depends if the routes are real or not – for example railway paths exist. As we generated routes from one port to another using this grid, the paths initially appeared straight like in an airline network, consistent with the default behavior in typical GIS software. However, leveraging Drake’s method within Grass enabled us to apply a smoothing technique, resulting in routes that naturally curved across oceans and seas (Figure 3).
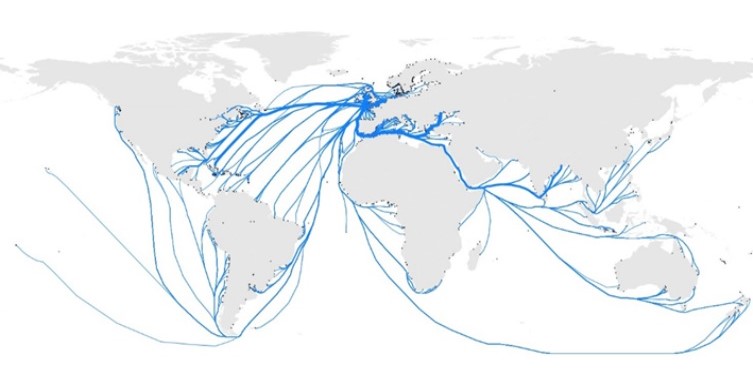
Figure 3. Maritime routes of the United Kingdom in 1880. (© Author’s elaboration).
It is not the same case for railway routes. Despite the shape of the graph, when it comes to represent the paths between stations, the image uses the existent paths reproduced by the Geographic Information System (GIS) (Figure 4).
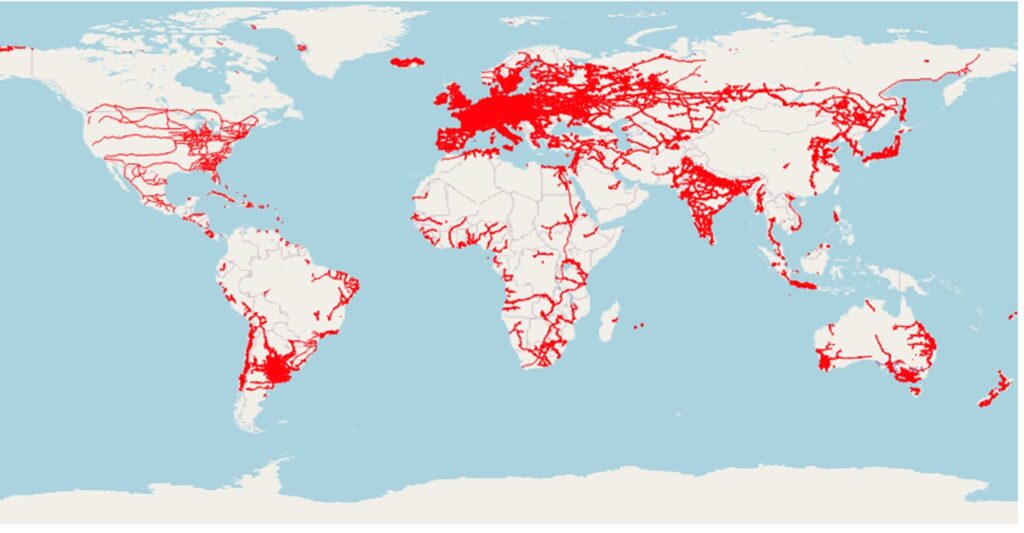
Figure 4. The global railway network in 1880. (© Author’s elaboration).
In conclusion, geomatics plays a critical role in understanding and managing the complex spatial relationships and processes that shape our world, contributing to informed decision-making and sustainable development across diverse sectors, such as network analysis and analysis of spatial data to understand patterns, relationships, and trends in geographic phenomena.
HEAD IMAGE | Maritime routes of the United Kingdom in 1880. Extract. (© Author’s elaboration).
╝
REFERENCES
DUCRUET C. (2023) Shipping network analysis: state-of-the-art and application to the global financial crisis. In: Ducruet C., Notteboom T.E. (Eds.), Port Systems in Global Competition. Spatial-Economic Perspectives on the Co-Development of Seaports. Routledge Studies in Transport Analysis.
DUCRUET, C. and BERLI, J. (2018). Measuring land-sea interactions at ports and cities : insights from geomatics and network analysis. Portus, 2018, 35, https://portusonline.org/.
DUCRUET, C. ; BERLI, J. SPILIOPOULOS, G. ; and ZISSIS, D. (2021). Maritime Network Analysis: Connectivity and Spatial Distribution. In Guide to Maritime Informatics, Springer, pp 299-317.
KANSKY, K.J. (1963). Structure of transport networks: relationships between network geometry and regional characteristics, Research papers, 84, Department of Geography, University of Chicago.