Government officials and companies have branded the Netherlands a distribution country, or Gateway to Europe, since the 1980s, building on a rich history of trade and transportation and focused on the Mainport Rotterdam and its hinterland connections to Germany and Belgium. The slogan has been backed up by large investment programs and business strategies, increasingly in the hinterland regions east from Rotterdam (Kuipers e.a., 2018). With around half a million jobs linked to logistics, it is now a key sector of the Dutch economy. This makes it hard to believe that four decades later there is still no detailed overview available of the Dutch logistic complex, especially regarding logistic buildings such as distribution centres [1].
Reports from the Dutch real estate brokers association (Bak, 2020) aggregate the growth of logistic buildings per region or province, making the information too abstract for design and policy decisions. Geo-spatial mapping is a good way to identify planning gaps (Hein & Van Mil, 2020) in what we might call the expanding logistic-scape of the port of Rotterdam. Therefore, one of my first tasks in the Ph.D. research Landscapes of Trade [2] was to produce such a map and make it available to the broader public through an online viewer [3] and to researchers, designers and policy makers as an open access spatial dataset (Nefs, 2021). This enables citizens and stakeholders to see patterns, raise concrete questions about ‘boxification’, congestion and other negative impacts of logistics (Aljohani & Thompson, 2016), and elevate the debate beyond the anecdotic NIMBY discussion of a single distribution centre. A first glance at the zoomable map already provides several items to discuss. In this article I focus on clustering, categories and context.
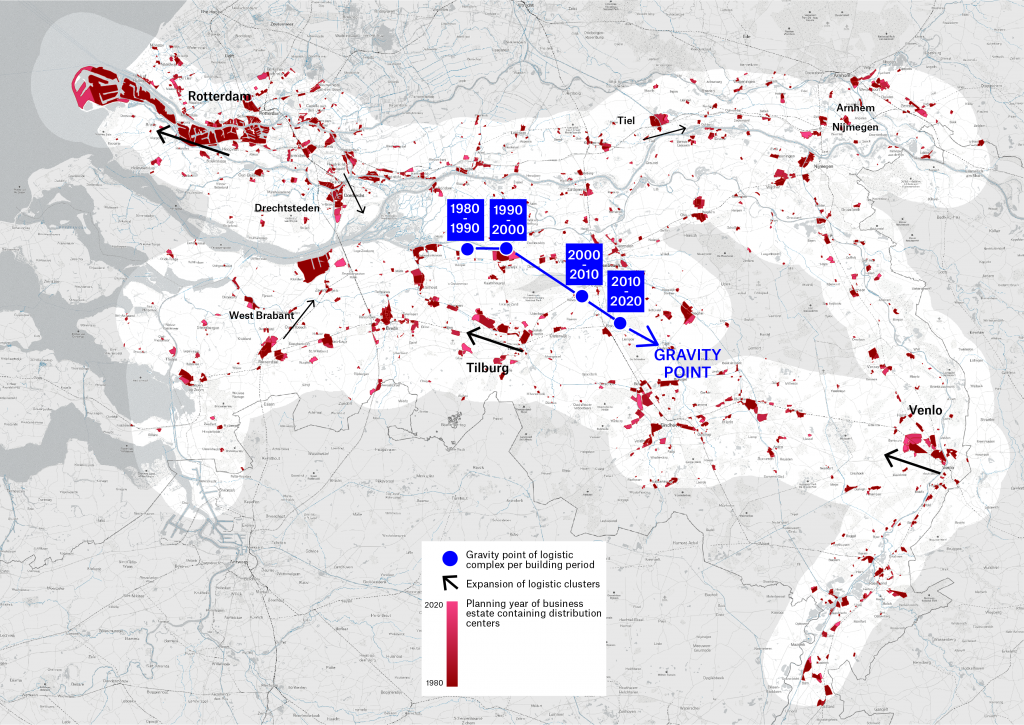
Clusters – growing west, shifting east
Since the 1980s, large clusters in the logistic complex have emerged, often strengthened by national and local policies. At the same time, the space in between such clusters has witnessed logistic sprawl, or fragmented developments that often piggyback on the success of the clusters nearby (Heitz e.a., 2017).
While the largest logistics hotspots (Tilburg, Rotterdam, Venlo) have expanded several kilometres westward in the last decades (see the Anyport model [4]), the gravity point of the entire logistic complex is clearly moving east. The average distribution centre built between 2010-2020 (weighed by size) is located 30 km more to the East than the average in the period 1980-1990. Besides demonstrating the process of port regionalization, or the emerging logistic delta, this eastward movement also shows the growing importance of the hinterland – companies choosing to be closer to customers instead of the sea port. And it points at the partial flipping of the entire complex, since goods increasingly arrive from the East over land. The Chinese Belt & Road initiative might be turning the port of Rotterdam from Gateway to Europe into the endpoint of the Silk Road (Frankopan, 2015).
Categories – a grey area
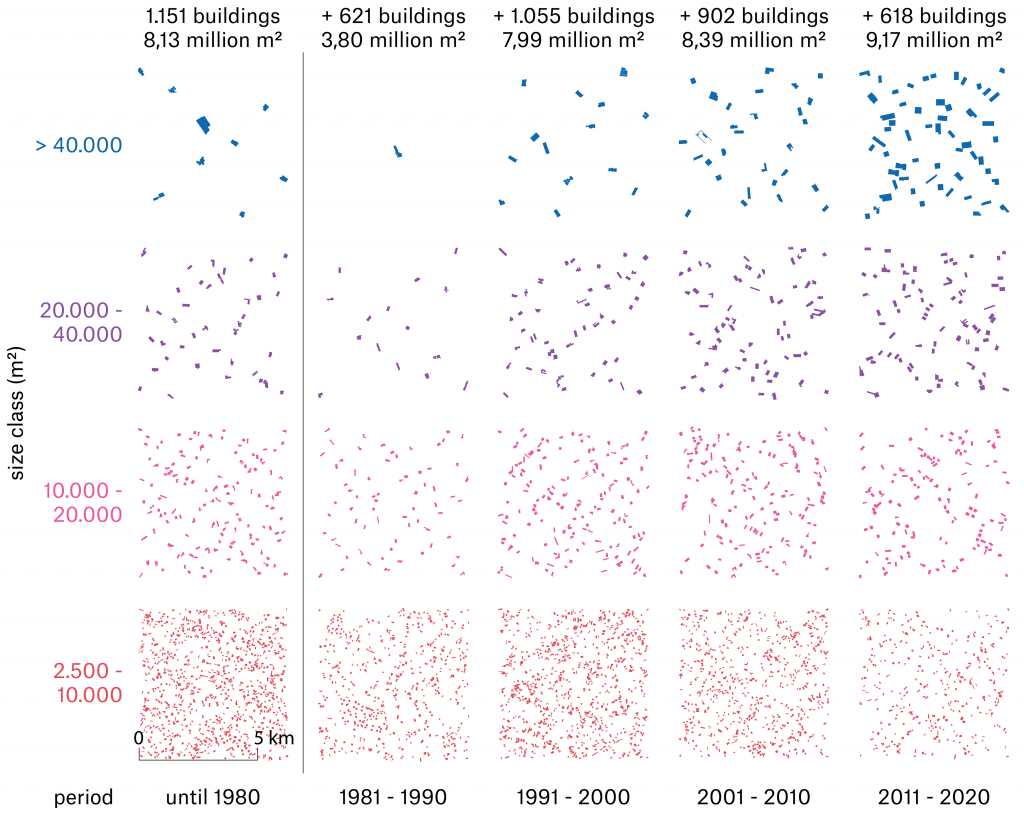
Distribution centres come in a variety of sizes, shapes and types, although recent ones are increasingly following international standards. A clear trend is the increasing building footprint, which for the whole corridor East-Southeast has grown from 8 to 38 million square meters since 1980. The average building also quadrupled, from 5 to 20 thousand m2. In practice, many recent distribution centres are built up of several of those buildings very close or ‘glued’ together into corporate complexes that can reach 300 thousand m2. Besides scale, there is a functional grey area of logistic-type buildings for activities that are a mix of logistics and manufacturing or farming. Examples are the buildings of the Tesla Motors automobile assembly and service plant in Tilburg, and various crop farming and agro-logistics firms near Rotterdam. Due to their registration as manufacturing or farming companies at the Chamber of Commerce, instead of logistics, Dutch company microdata [5] underrepresents logistic activities in the Dutch territory. This means that the logistic complex is in fact even larger than it appears on the map, if one would include cross-overs.
Context – beyond the planner’s debate regarding hectares
Not only the distribution centres themselves, but also their location relative to population centres and infrastructure, determine their impact and sustainability (on the difference between footprint and area of influence, see Bélanger & Arroyo, 2016). Do they block the landscape view, contribute to local road congestion and have access to multimodal transport hubs? Can they source local workers and products or do they rely on migrant labour and global supply chains? These questions are too complex to answer in a single map, but without mapping there is no answer at all.
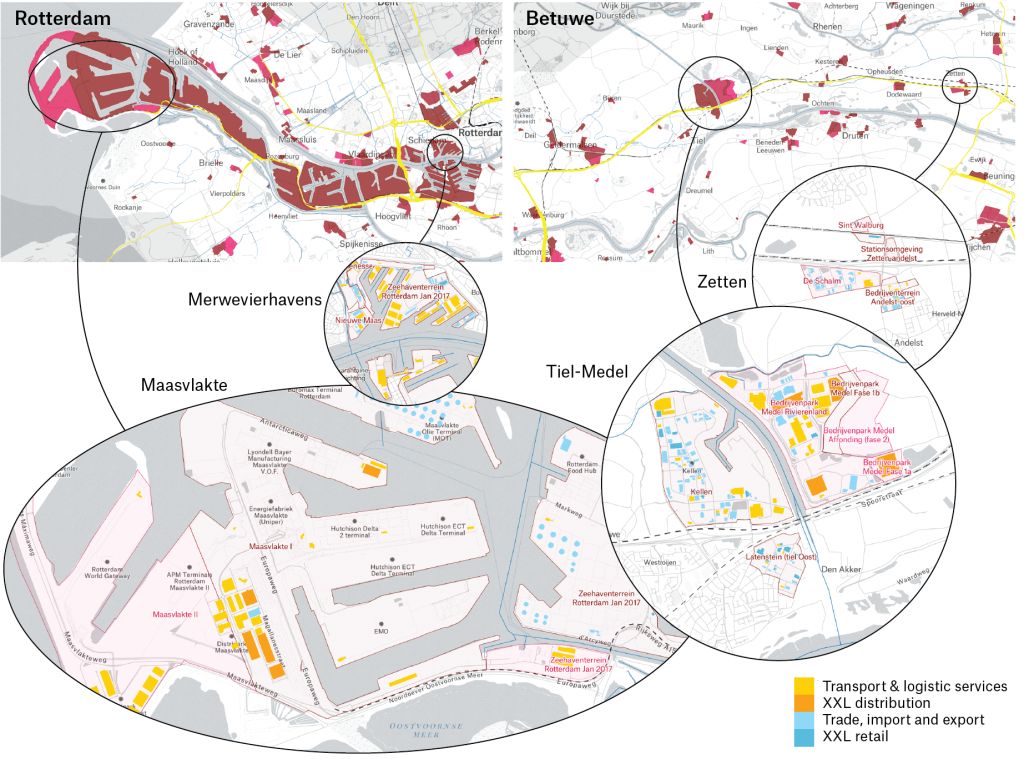
Let’s have a quick look at the chain of fruits in the Rotterdam port area and a region in the hinterland, the Betuwe. The Betuwe is known for its fruit products (juice, jam) and much of its logistic system in 1980 was focused on fruit imports and exports. Recent XXL distribution centres in the area, however, use primarily the central location in the Netherlands, to distribute just about anything – except for local fruit. Some developments are clustered close to a multimodal hub in Tiel, which makes sustainable transport possible, while there is truck-oriented logistic sprawl in the east of the Betuwe. Moderate congestion is expected in the area.
The port of Rotterdam has tapped into the fruit chain since the 1980s, but in the form of large juice terminals and refrigerated containers [6] near the city centre and recently on the Maasvlakte port extension area, in between the oil companies [7]. Multimodal transport is possible, and advisable, since heavy road congestion is expected here. While these distribution centres certainly have a smaller landscape impact than those in the Betuwe, emission levels in this area are among the highest in Europe, and workers at the remote Maasvlakte have a very long commute. In both areas, logistic operations require substantial migrant labour, which causes housing issues.
The societal complexity of logistic developments, briefly indicated above, calls for a multi-faceted focus in logistic planning, beyond the mere allocation of available space near infrastructure. Research by design can be part of such an approach. We have only just begun to understand the logistic complex of Rotterdam and its hinterland. The mapping of distribution centres shows that a spatial lens is necessary to shed light on the societal and strategic aspects of logistics. These include many dimensions, such as landscape, biodiversity, congestion and emissions, economic sectors, education, automation, migration and quality of jobs.
Head Image | Distribution centre in the South of the Netherlands. (© Merten Nefs, 2020).
Notes
[1] I define the logistic complex as the inseparable combination of public transport infrastructures and private logistic buildings, which make supply chain operations possible. Comprehensive maps of logistic buildings are probably, at least partially, available at consultancy and broker firms. These are, however, never made public since they are part of the company’s business model or strategy.
[2] See http://landscapesoftrade.nl/.
[3] See http://mertennefs.eu/landscapes-of-trade/ for the map viewer and information regarding the used data. The data and map will be expanded to include a large part of the Netherlands, part of Flanders and North Rhine Westphalia until the end of 2021.
[4] The Anyport model by Bird (1963) and the Port-City model by Hoyle (1989) describe port expansion and urban growth processes of port cities, usually moving towards the sea.
[5] LISA data, a commercial dataset that cannot be shared publicly.
[6] As a ‘reefer’ hub, Rotterdam has become the second largest avocado export location in the world, without having any avocado producer nearby.
[7] Innocent recently built a large juice distribution centre at the Rotterdam Food Hub.
References
Aljohani, Khalid and Thompson, Russell (2016), Impacts of logistics sprawl on the urban environment and logistics: Taxonomy and review of literature. Journal of Transport Geography 57. Elsevier B.V.: 255–263. DOI: 10.1016/j.jtrangeo.2016.08.009.
Bak R.L. (2020) Logistiek vastgoed in cijfers 2020. NVM.
Bélanger, Pierre and Arroyo, Alexander (2016), Ecologies of Power: Countermapping the Logistical Landscapes & Military Geographies of the U.S. Department of Defense. MIT press, ISBN: 9780262529396.
Frankopan P. (2015) The Silk Roads. Bloomsbury.
Hein, Carola and Van Mil, Yvonne (2020), Mapping as Gap-Finder: Geddes, Tyrwhitt, and the Comparative Spatial Analysis of Port City Regions. Urban Planning (ISSN: 2183–7635) 2020, Volume 5, Issue 2, Pages 152–166 DOI: 10.17645/up.v5i2.2803.
Heitz A., Dablanc L. and Tavasszy L.A. (2017) Logistics sprawl in monocentric and polycentric metropolitan areas: the cases of Paris, France, and the Randstad, the Netherlands. Region 4(1): 93–107. DOI: 10.18335/region.v4i1.158.
Kuipers B., Van der Lugt L., Jacobs W., et al. (2018), Rotterdam effect – de impact van mainport Rotterdam op de Nederlandse economie [the impact of mainport Rotterdam on the Dutch economy]. Rotterdam: Erasmus UPT.
Nefs, Merten (2021), Distribution centers 1980-2020 Geodata, 4TU. ResearchData, Dataset, https://doi.org/10.4121/14791686.