The ability of ports to ensure efficient cargo transfers is one central dimension of their overall function as transport nodes. While port efficiency as a whole may be understood from various perspectives, its influence on trade facilitation (Clark et al., 2004) and regional development (Doi et al., 2001; Haddad et al., 2010) has been well underlined. Ways to measure port efficiency and performance are very diverse (Tongzon, 2001; Itoh, 2002), but the time factor has been so far largely left aside, especially in international comparative studies of ports. More frequent are case studies of specific aspects such as fast-ship services (De Langen, 1999), broader approaches such as the global synchronization of transport terminals in a context of space/time collapse (Rodrigue, 1999), or operations research about queuing models of vessels in relation to port entrance channels and berth allocation and productivity. A global and geographic of time efficiency thus remains missing, although it would provide a better understanding of port operations as a whole and, to some extent, of the territories where such ports are located. This exercise would also contribute to further discussing the geographical dimension of port operations, beyond sole technical and economic factors (Ng and Ducruet, 2014).
Time in port studies
This paper hypothesizes that beyond individual situations, the time efficiency levels of ports and shipping networks might exhibit certain commonalities functionally and/or regionally. The scattered dimension of existing works made of monographs and small port samples has not been able to answer such crucial questions satisfactorily.
In addition to such gaps, research remains hampered by missing information on time efficiency itself, as underlined by De Langen et al. (2007, p. 31): “even though ship turnaround time is already discussed in academic literature for more than 30 years (…), no port systematically reports the ship turnaround times. This turnaround time includes the time spent with entering the port, loading, unloading, and departing. Even though this is clearly relevant for shipping lines [in terms of related port costs], ports do not report turnaround times in annual reports or other publications“. And even if it possible to qualify these statements – as various ports collect data on vessel turnaround times, and the maritime industry itself also provides various time-related metrics – the lack of a systematic and comparative study on vessel turnaround times in ports remains striking.
Challenges to a global analysis of shipping time
Numerous port performance indicators (PPIs) have been proposed since the seminal works of United Nations in 1976. Since then, the number of port performance studies has increased tremendously, applying various methods to small samples of ports worldwide. Size of port infrastructure and traffic volume are the most widely accessible indicators internationally. For the rest, there is a wide diversity of measures and methods among ports of the world (De Langen et al., 2007). Beyond the transfer of cargo, operational indicators are not often used in the scholarly literature. Port throughput volumes may be analyzed in various ways, such as divided by the length of quays to measure productivity or by the total throughput of a given port range or maritime region to measure a market share. The precise modal split, monetary value, and hinterland geographic distribution of traffics remain, however, often inaccessible on a large scale (Itoh, 2013). Port and terminal authorities can modify the container dwell time in order to gain space and increase the capacity of storage yards.
There are inherent challenges to international comparison. First, different ports have different regulations in terms of hours of operation (i.e. number of hours and shifts that terminal gates are open). Again, authorities may extend such hours in order to increase their productivity without expanding existing infrastructure. However, there is a risk that stacking costs increase as the land utilization rate increases. Transit time thus also relates with the other indicator of the number and frequency of ships visits. Second, official port statistics are not always clear about the exact meaning of turnaround time, i.e. whether it applies to the time spent inside the port or to the whole trip of the vessel including also the entrance channel and queuing time outside to/from the port. Thus, so-called productivity indicators are usually preferred such as by dividing port traffic volume per total length of quay. These indicators closely resemble the various performance metrics that can be acquired via specialized port consultancies, such as Drewry, and which include comparative information on utilization rates (such as TEUs/year per crane, vessels/year per berth, TEUs/year per hectare and containers/hours per lane) as well as productivity (moves per crane-hour, vessel service time, truck time in terminal and number of gang moves per man-hour). These databases suggest that on average large port terminals handle yearly 110,000 TEU per crane, reach 25-40 crane moves per hour, and have an average dwell time of import boxes of 5-7 days and export boxes of 3-5 days (Merk, 2013).
Transit time has, however, increasingly been integrated in studies of port performance, based on the fact “that customers are concerned not only with transport costs in selecting which carriers they will use and the routing undertaken, but also with a range of other factors including safety, traceability, reliability and transit times” as mentioned by Slack and Comtois (2013) in their study of ocean transit times. Besides more general discussions on such topics (Tongzon and Sawant 2007), some authors have proposed specific studies of container flows in liner shipping looking at congestion issues in ports (Notteboom, 2006; Leachman and Payman, 2012), but also advanced modeling including all aspects of port and vessel operations of which total voyage time, voyage time at sea, voyage time in port, average port time, and vessel speed (Moon and Woo, 2013). The latter work is rooted in earlier studies of transit time performance of ocean carriers (Saldanha et al., 2006), notably those looking at time uncertainty in shipping and port operations (Wang and Meng, 2012; Qi and Song, 2012) and measurements of the time factor in liner shipping network design through mathematical modelling (Alvarez, 2012).
Suarez-Aleman et al. (2013) rightly argued that very few empirical studies have been made about time efficiency, although such aspect is known to be crucial and despite the possibility for inefficient ports to remain attractive for other reasons. One early exception is the study by Edmond and Maggs (1976) of five United Kingdom ports, concluding that no simple linear relationship existed between ship size, handling rate and ship berth time, but one may argue that the study sample might have been too small for such a statistical approach. In the same vein, Heaver and Studer (1972) concluded that, for instance, many factors may blur the relationship between ship size and loading time, such as weather, dock labor, and market conditions, the importance of time to vessel operations, and the number of berth changes, but overall, their study of Vancouver demonstrated a solid correspondence between the two variables.
Indeed, and as suggested by Goss (1967) in his study of turnaround times, a vast literature had already addressed such issues back in the 1950s with the objective to finds ways to reduce excessive port time and overall sea transport costs. More recent studies include the search for factors influencing time efficiency in Latin American ports, such as container loading rate, containers loaded per vessel, and waiting times (Sanchez et al., 2003), the analysis of the relationship between port characteristics (of which cargo delay during customs procedures) and maritime transport costs, and the detailed analysis of the components of vessel time in ports and the determinants of port inefficiency, such as customs clearance, container handling charges, cargo handling restrictions, mandatory port services as well as a crime index (Clark et al., 2004). What becomes clear in such works is the multifaceted character of time efficiency. As defined by Suarez-Aleman et al. (2013), “port time” is the combination of several components such as port access time, loading and unloading times of cargo, ship waiting time, and time for customs and other administrative procedures. The authors have particularly shown that among African ports, overall efficiency may not be always affected by time factors, especially for some ports where competition with other modes and other ports is limited.
Considering the focus of the academic community and industry community on such metrics, it remains surprising that no previous global, systematical analysis has ever been done on such matters. Specialized port consultancies collect time-related port terminal performance metrics, which include average container handling time, crane productivity and gang productivity. Similar productivity metrics are collected by some shipping lines, e.g. Maersk with its Daily Maersk Efficiency Ranking. Moreover, various ports systematically collect the vessel turnaround times in their ports. Examples are the ports of Durban and Shanghai, as illustrated by the OECD Port-City studies on these places (Hong et al. 2013). What is more, some ports have formulated targets on the average vessel turnaround times in their port: one of the maritime operations targets for the Port of Durban by the Transnet National Port Authority in South Africa is an average container ship turnaround time of 59 hours for the year 2013/2014. Latest works on the matter include Guinand and Pigné (2015) with a very original analysis of port centrality evolution along 365 of navigation using time windows, and Slack et al. (2018) comparing ATTs at 70 ports of call along the major routes, concluding that “the results are weak and lead to a hypothesis that ATTs are differentiated regionally and functionally, rather than globally”. This stands in contrast with a previous OECD report (Ducruet et al., 2014) devoted to the comparison of ATTs’ distribution and evolution at three specific years at country and port level, which among other results demonstrated that a higher centrality of ports located in richer countries reduces turnaround time.
Empirical analysis: application to container shipping flows
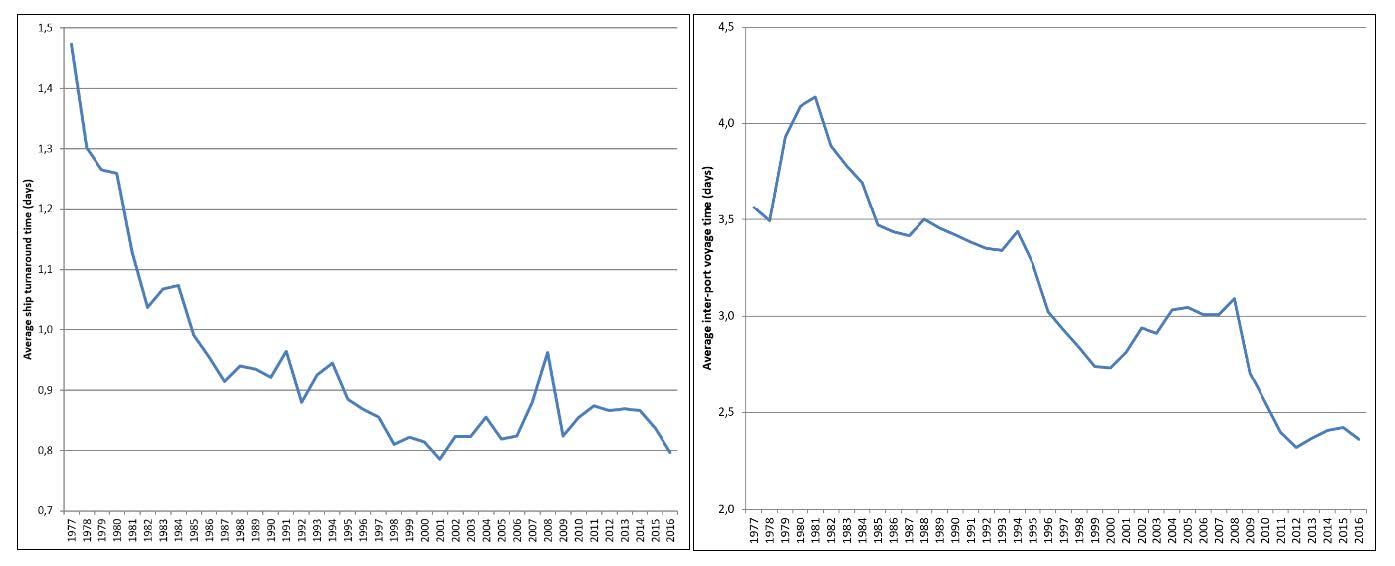
The application of our methodology, based on the leading shipping data provider Lloyd’s List Intelligence (LLI), to the measurement of average ship turnaround time (ATT) and inter-port voyage time (VTT), provides for the first time good evidence about the acceleration of port and shipping operations across the world (Figure 1). Without any doubt, but despite certain fluctuations, both ATT (left-hand side) and VTT (right-hand side) underwent constant decrease all over the study period. Technological progress in terminal operations and vessel propulsion definitely and enormously changed the way containers are moving and how trade is performed when it comes to the most valued goods. Other factors come to play, such as the gradual diffusion of modern technical standards, and the aforementioned concentration, rationalization, and port/route selection by shipping lines, in turn fostering port competition. The emergence of hub-and-spokes and interlining services mainly in the mid-1990s in a period of liberalization, permitted concentration but also a higher shipping frequency over shorter distances as feeder services, for instance between hub ports and their adjacent secondary nodes. Nevertheless, from the early 2000s, ATT ceased to decrease (or slightly increase until 2008), stagnating around 0.8 to 0.9 days on average for ports to handle containerships. The peak value of 2008 is more a symptom than a result of the global financial crisis, as it should in theory occur in 2009, as the crisis provoked a massive slowdown with many ships remaining idle in several ports. Although the last two years of ATT again decrease, the values of ATT do not go under the lowest one reached in 2001 (left-hand side).
In terms of inter-port voyage time (VTT), a similar evolution is observed, despite noticeable differences compared with ATT. Early years were getting slower so it is only since the early 1980s that VTT starts decreasing (right-hand side), but not as rapidly as ATT. A first round of acceleration gradually occurs until the mid-1990s, then VTT falls abruptly (cf. hub-and-spokes systems etc.), but since the early 2000s goes up until 2009, or the global financial crisis, because of congestion on the sea and higher transport demand. Despite rationalization and port selection, the number of ships constantly grew at that period so that they lost in speed on average, shipping lines putting in place longer services from pendulum to round-the-world, calling at more mutually distant ports. The effect of the global financial crisis is somewhat counter-intuitive, given the literature about slow steaming which is commonly accepted by the scientific community and by transport actors. But slow steaming is a strategy mainly adopted by (only) giant vessels on the most lucrative routes for more efficient fuel consumption on the sea, and therefore did not affect the continued acceleration of (aggregated) shipping flows on average because of most short distant and feeder services. From 2012 however, we observe another stagnation that seems to end in 2016.
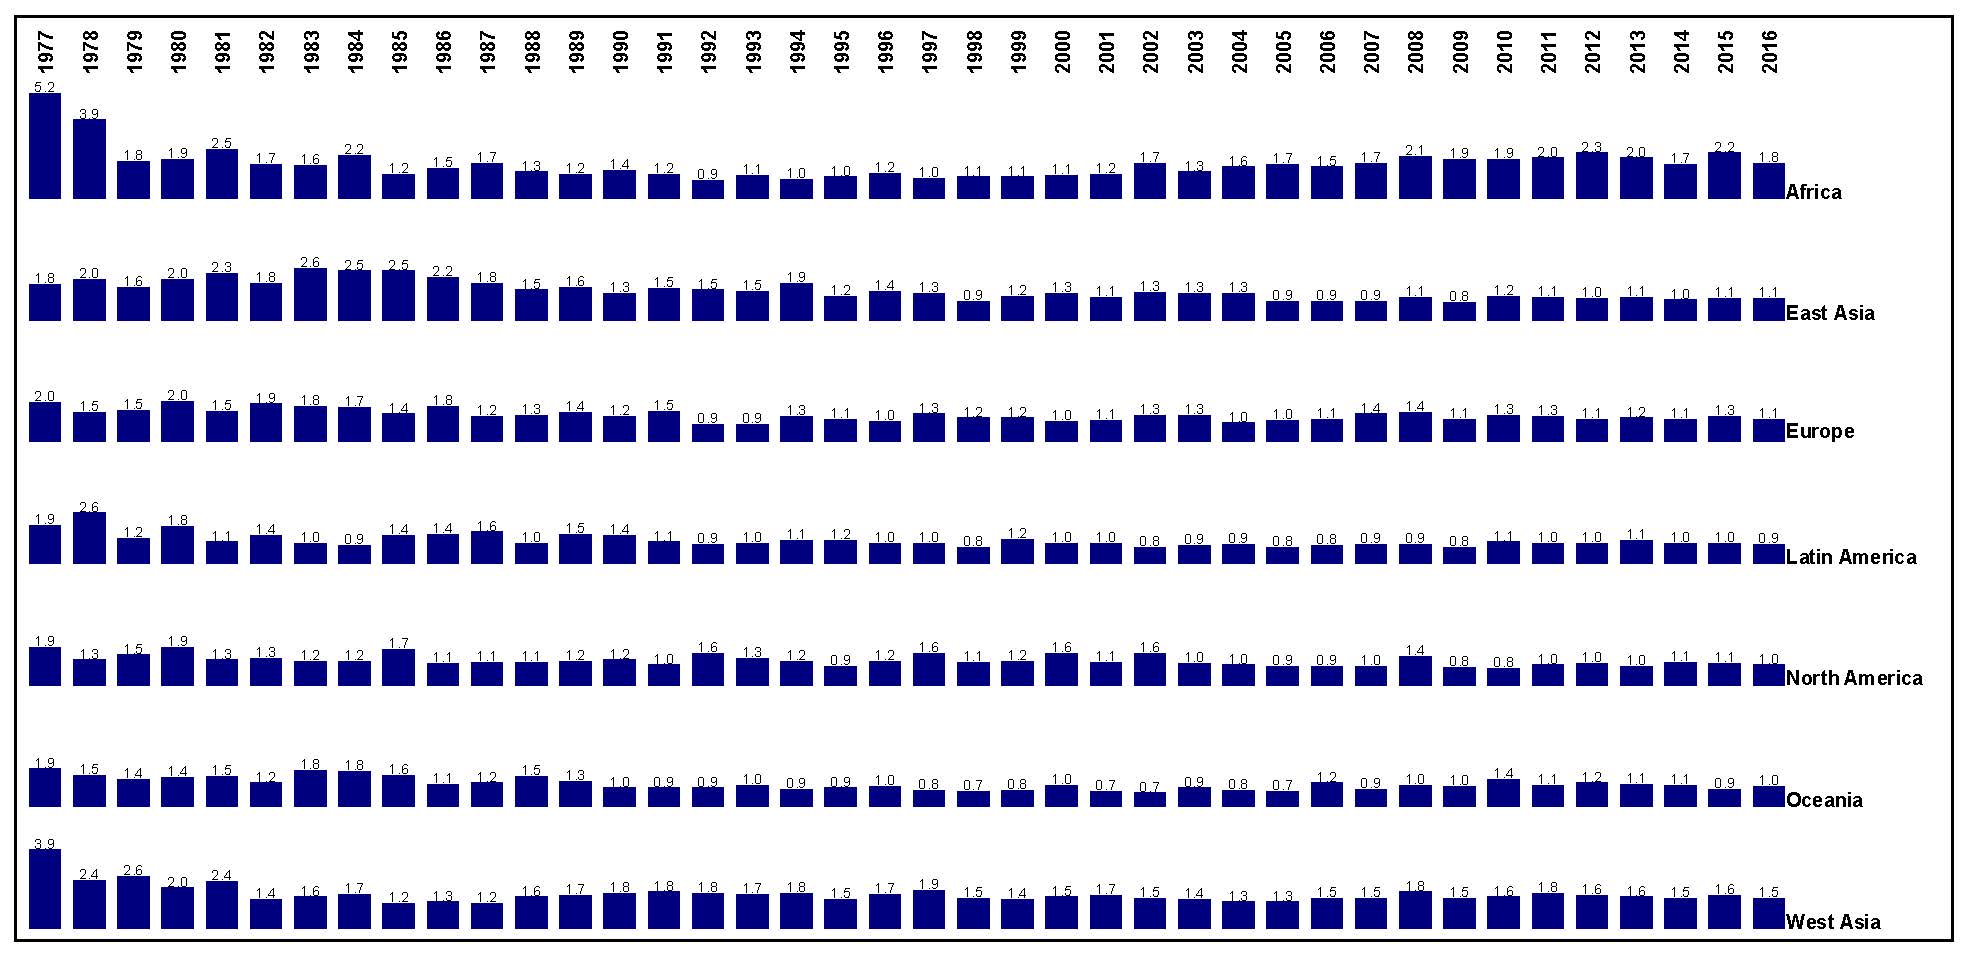
At the level of world regions, common trends but also divergence emerge (Figure 1). While as for world average seen above, port time had gradually went down, this is not the case across all regions. In 1970s and 1980s, the deviation of VTTs on regions had been wider than in 1990s and before the global financial crisis because of different timing of containerization and developments at ports. Of course, the large unit of analysis may influence the results, mainly through the Cold War effects and the division of Europe between East and West. This might explain why Europe as a whole is not the best performing region of the world despite its current dynamist (see also Figure 9); from the 1990s to nowadays, Oceania and Latin America offer faster turnaround times on average especially at the second half of study period. Other regions exhibit interesting fluctuations, as Africa starting and ending as the worst performing region except in the period 1990s-2000s. Other regions show a gradual decline of ship time, through a continuous improvement, but from different initial levels, the fastest growing improvement being the one of East Asia, although West Asia started at similar levels and improved more rapidly in mid-1980s, but ends the period with worse scores than East Asia.
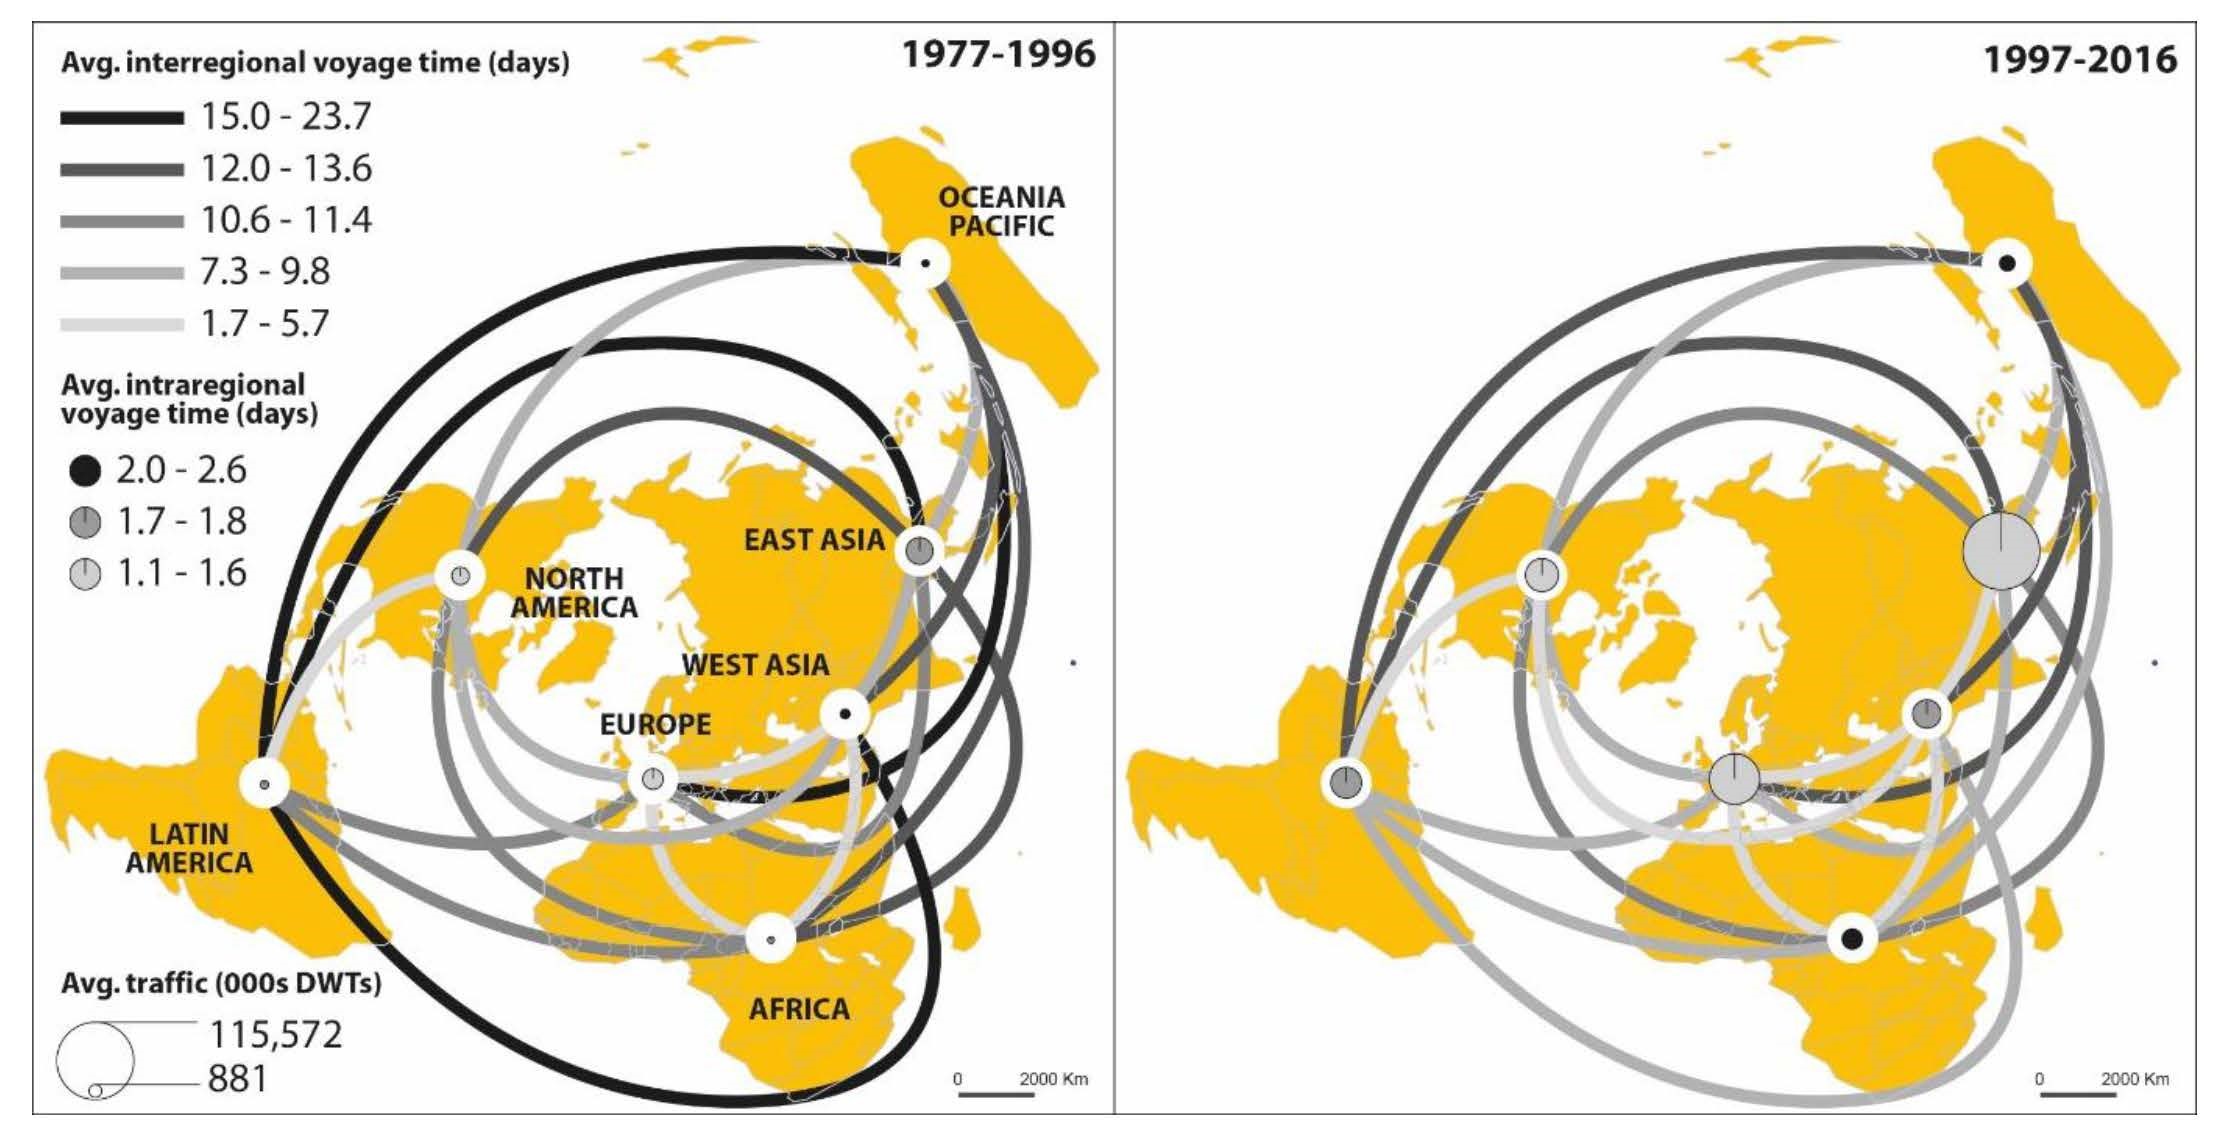
In terms of interregional flows (Figure 2), one may observe, between the first half (left-hand side) and the second half (right-hand side) of the period important changes as well as permanencies. The latter shows that the main traffic poles of the so-called “Triade” (North America, Europe, East Asia) have relatively low voyage times (lighter color on lines) with each other, thereby constituting the “core” of the global liner shipping network, where most modern vessels and largest carriers operate. Of course, we also see an effect of geographic distance are remotely located regions need more time to connect, such as flows to/from Latin America and Oceania, except with their neighboring regions (i.e. North America and East Asia, respectively). In terms of changes, most routes underwent faster voyage times in the second period. Yet, internally, or in terms of intraregional flow, only Europe and North America have low values of intraregional voyage time (1.1 to 1.6 days on average), while in the second period, East and West Asia improved, Africa worsened, and Oceania and Latin America remained in the medium category. These broad trends at the level of entire continents are useful before diving into the more detailed analysis of individual port time.
At the local (port) level, based on the GIS Geoseastems presented in Portus (Ducruet and Bunel, 2017), we decided to create an interpolation of those data to create a seamless information throughout the globe (Figure 3). This raster does not intent to represent the truth, neither to fill in the missing data as port calls duration is not homogeneous but highly contextual. Indeed, it rather is a matter of on-site infrastructures, specializations, vessel shipment and size, etc. Thus, those maps are mostly a way to easily spot areas in which calls duration are high or low. The interpolation was generated using the Inverse Distance Weighted (IDW) method to avoid the generation of smooth gradations of the Spline method. Those interpolations are used as base maps on top of which ports are displayed, their size depending on the amount of traffic they respectively drain and their color depending on the average duration of calls, or three levels of ATTs at each time (year).
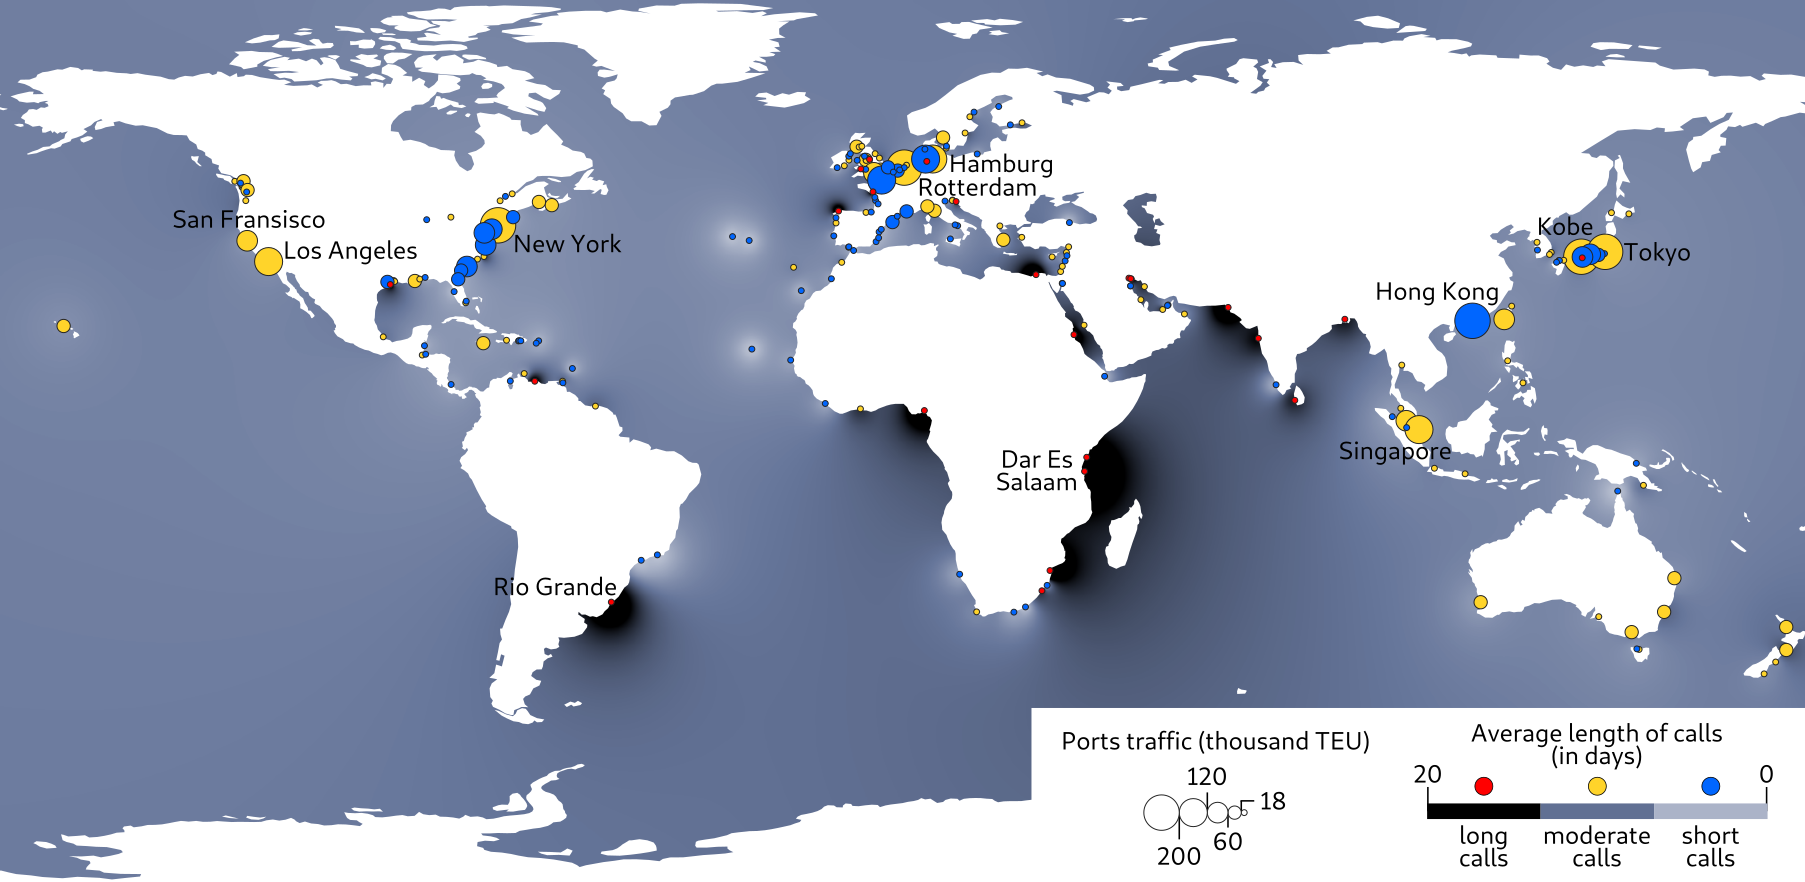
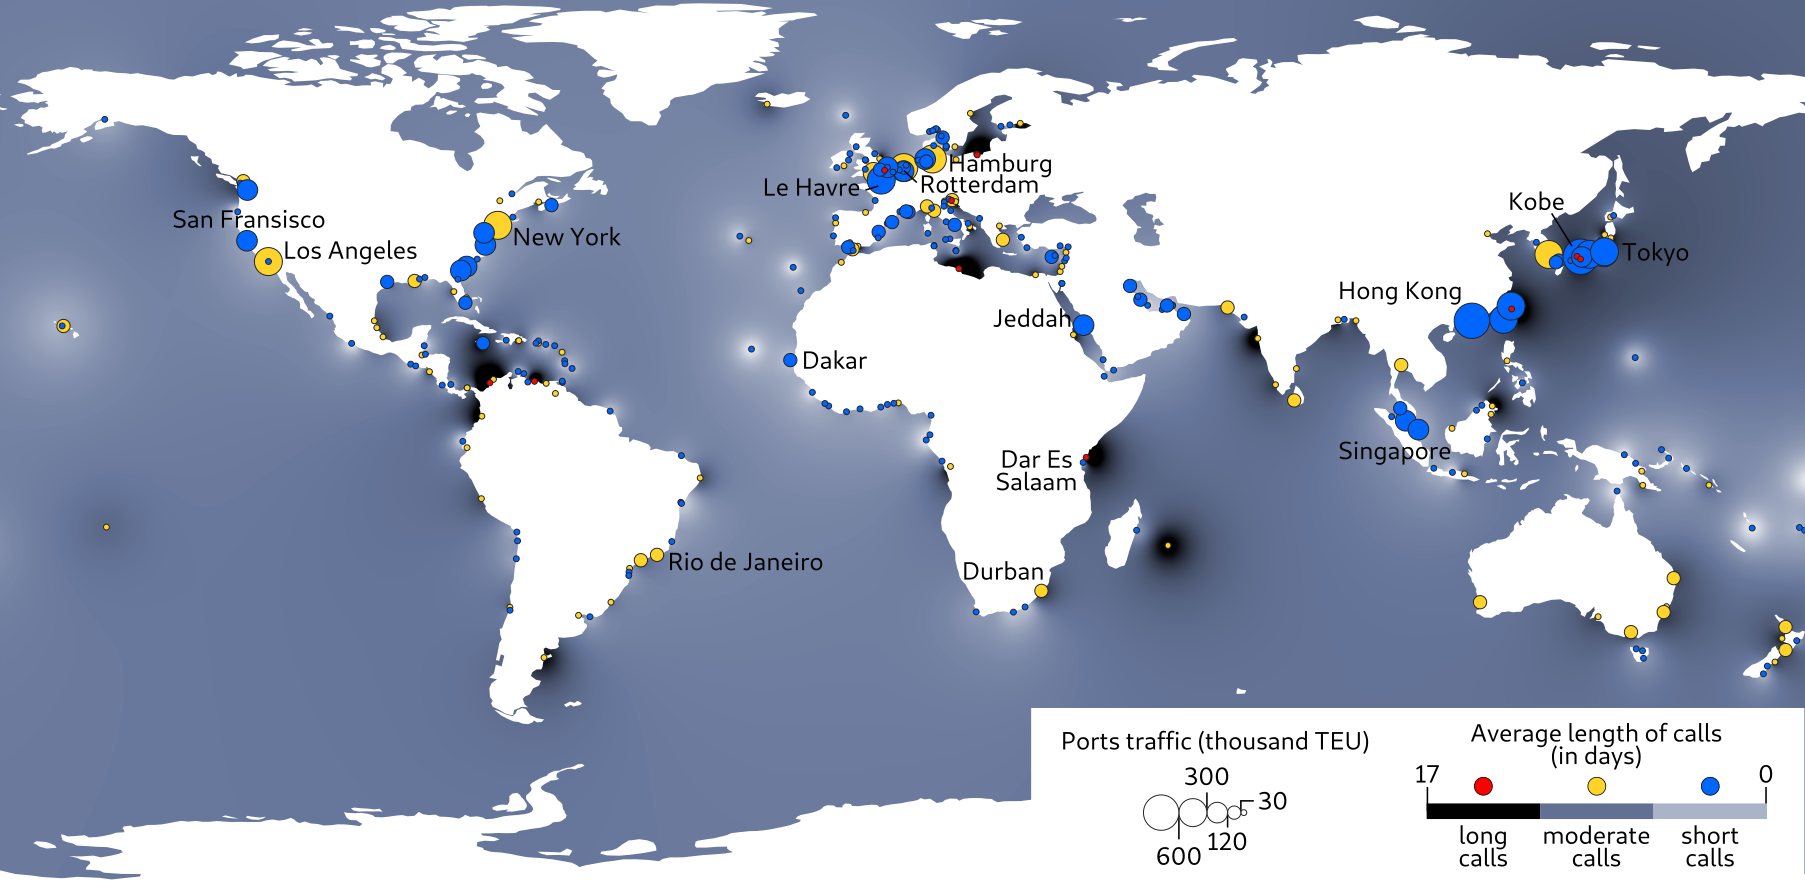
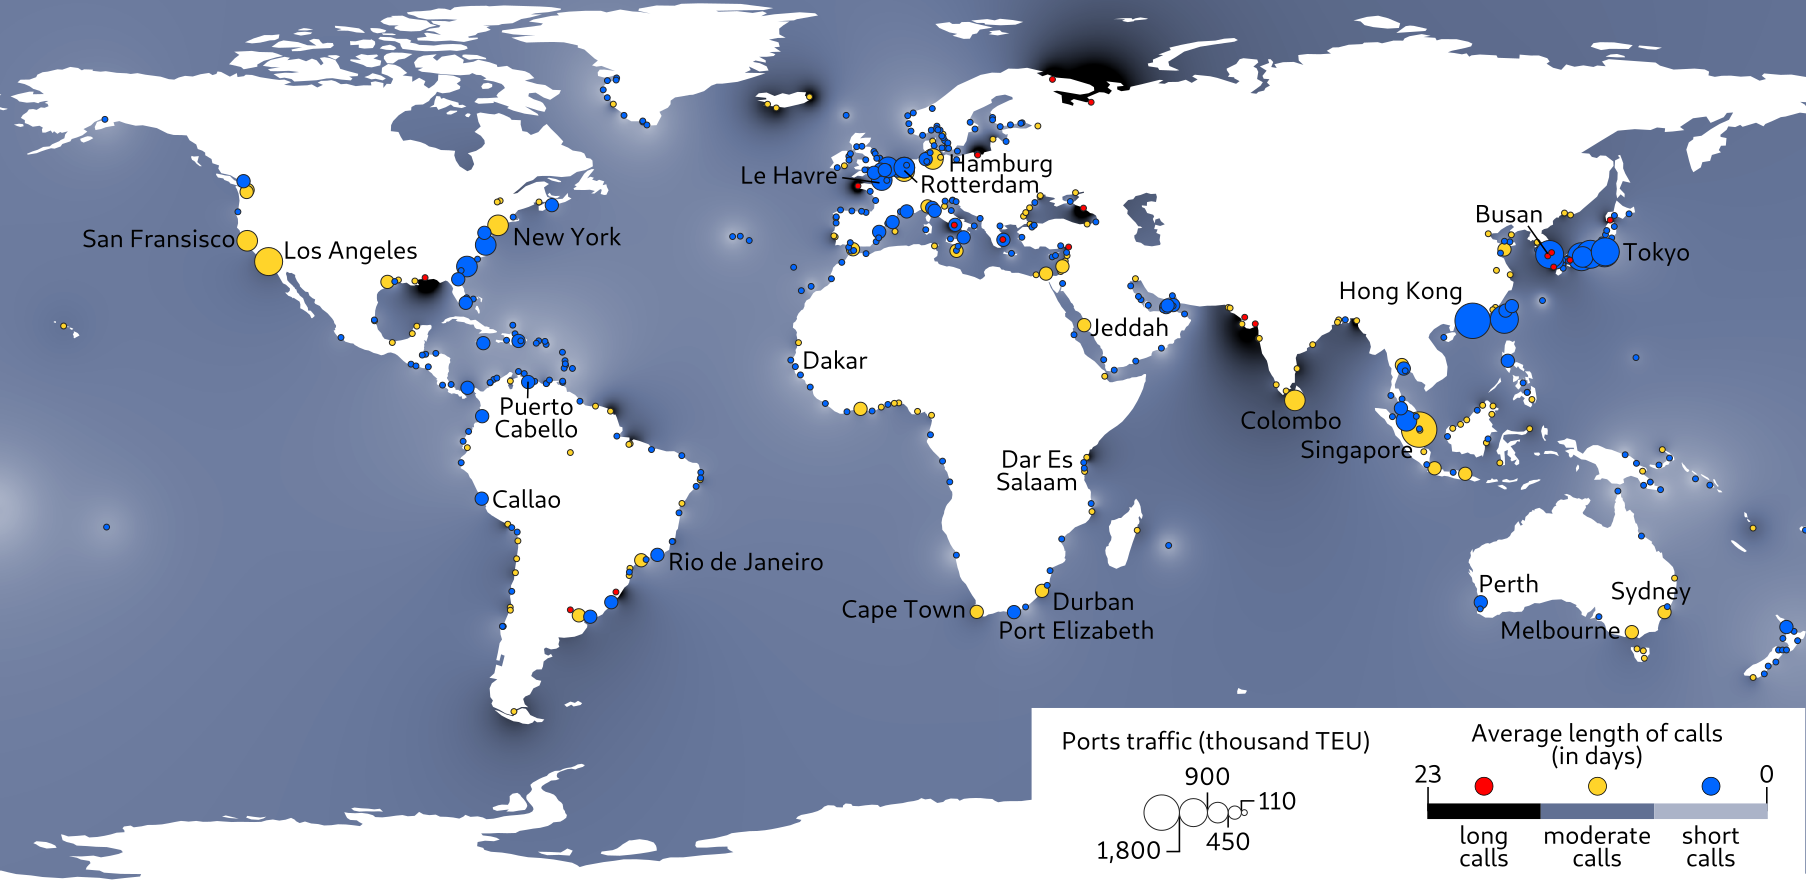
The first notable feature reflected by the maps is the absence of correlation between the level of development and the duration of calls, at least since the 1980s. Indeed, while in 1977, most ports located in the southern hemisphere (East Africa, Gulf of Guinea, South America, India) present long calls unlike in the northern hemisphere (Europe, North America, North-East Asia) – that situation is more balanced ten years after. Calls duration seem to be more related to the amount of traffic they bear as longest calls are observed throughout the world in smaller traffic ports. One may argue that corruption can be a factor explaining the higher length of berth in ports such as Maputo, but it had been proven that corruption doesn’t affect vessel’s berth duration but mainly influence trade firms’ decisions (Sequeira and Djankov, 2008). Among the many factors of port efficiency directly affecting the duration of vessels’ berth, inadequate quay, crane equipment, and truck turnaround time seems to bear the most importance (Nyema, 2014). It explains the long calls observed in East Africa (e.g. Dar-es-Salaam, Mombasa). In 1987, the situation appears to be less polarized around the Global South as ports with long calls are more evenly distributed between the South and the North. From the 1970s to the 1990s, Japan, Taiwan and China significantly shortened the duration of ships calls in their ports while increasing their traffic.
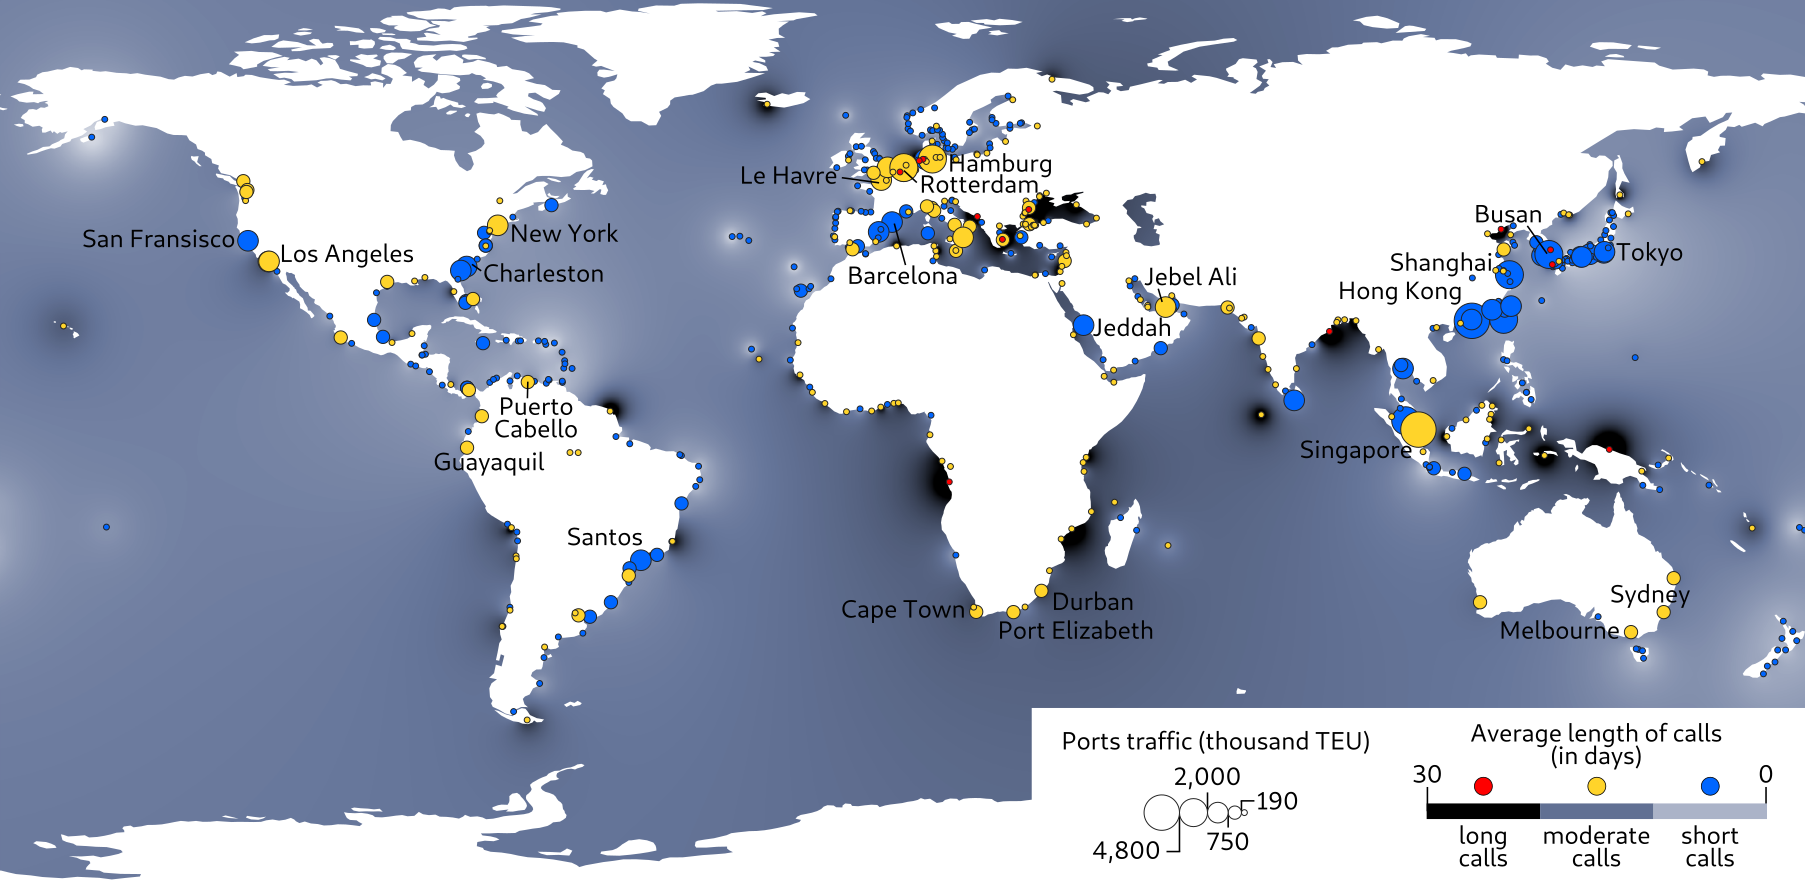
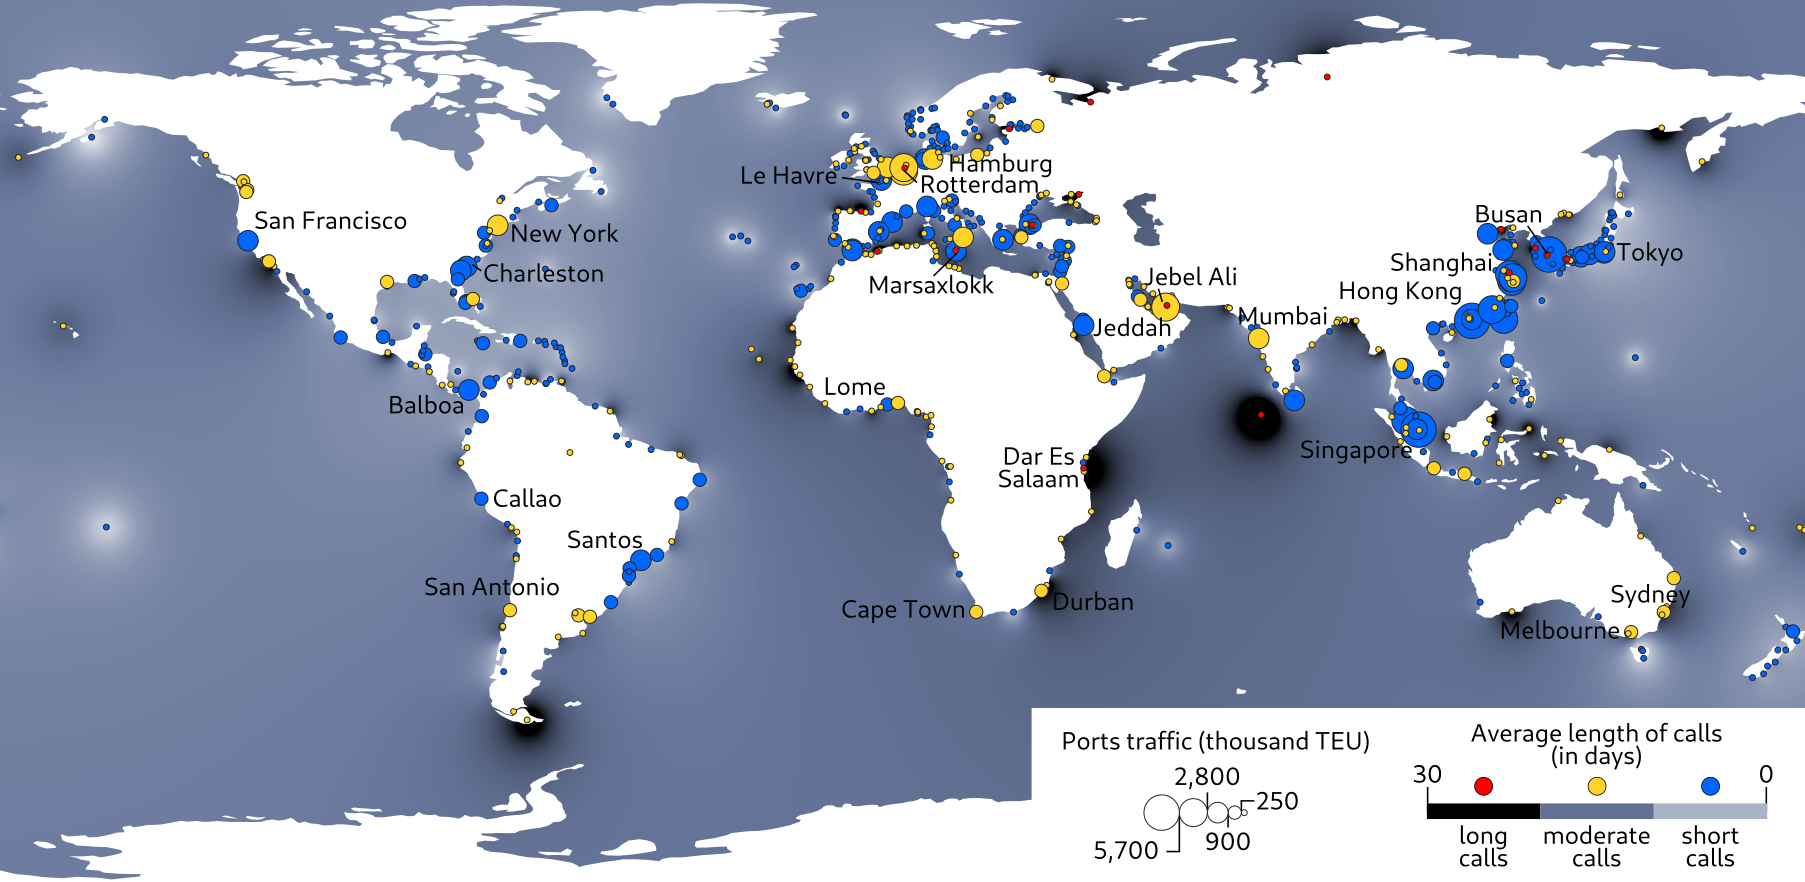
In 2007, the overall trend changes, the world traffic is substantially raising along with the calls duration, this fact is noteworthy in Europe (Mediterranean and Northern Europe) and in the Gulf countries. Eastern Asia in 2016 has both high traffic and short calls attesting well-organized infrastructures and merchandises management combined with large berth capacity. There are, as well, stable ports which does not vary much over the years. This is the case of remote islands such as the Azores and Polynesia, and most of Australia. They maintain a steady traffic and relatively short calls from the 1970s to this day. Lastly in 2016, the times at the ports in Northern Europe and Mediterranean ports went longer calls than in 2007.
Conclusion
This research is the first attempt to analyze the average number of days that container vessels spend at and between ports of the world over the last 40 years. It complements earlier by its wider time and geographic scope. Another advantage is that it covers the whole fully cellular container fleet. Discussions, however, would be useful to include or not mixed ships, especially in the early period of containerization, such bulk or passenger vessels carrying also containers [2].
It often happened in the past that general cargo ships for instance took aboard container with being dedicated. Another possible bias in our results is the impossibility to define with precision about ship time in ports, as the day is the unit of measure, not the hour, and we do not know if this call includes other navigation operations on the top of berthing time. Nevertheless, and given the exhaustiveness and scope of our database making it rather unique, a number of interesting findings have been proposed.
In terms of statistics, we demonstrated the acceleration of global shipping both within and between ports along 40 consecutive years. We also showed that ship time is far from being randomly distributed. On average, largest ports perform better than smaller ports, while the longest and the shortest inter-port linkages are the fastest lanes. Regional differentiation was one vital addition to such results by being closer to the ground. Geographically, large regions of the world underwent the same global trend of trade’s physical and technological acceleration, but some important discrepancies and “waves” (Guerrero and Rodrigue, 2014). Some regions constantly improved through modernization while others lost performance for mainly political reasons.
Further research may confront average ship turnaround time to a wider variety of port-related indicators, such as those on infrastructure and facilities, but also about governance aspects such as terminal concessions (see Parola et al., 2013), congestion indices at the port or city level for instance (Vonck, 2014), indicators on sea-land connectivity (Ducruet and Berli, 2018) the presence of major terminal operators, and the distance to main trunk lines (Zohil and Prijon, 1999). Our results are intended to be confronted to broader measures and more classic measures of port and shipping activity such as port hierarchy (i.e. total, average traffic by port), network indicators (e.g. centrality, accessibility), and urban indicators (e.g. population size). Larger ports are theoretically more robust to traffic variations, market fluctuations, and external shocks than smaller ports. The urban economy around the port may constraint or foster port activity depending on the availability of space and the level of congestion land-use competition. Network analysis would prove useful to confront time indicators with centrally indicators, especially because larger traffic volume does not always mean higher centrality (Ducruet et al., 2010). The use of network measures is thus a novel and original way to test the role of network design on time efficiency. As argued elsewhere, hub functions of ports should foster time efficiency due to many advantages such as deep-water sites, space availability, and modern infrastructure for ensuring rapid transshipment.
Acknowledgements
The research leading to these results has received funding from the European Research Council under the European Union’s Seventh Framework Programme (FP/2007-2013) / ERC Grant Agreement n. [313847] “World Seastems”.
Notes
[1] This paper was presented at the IAME conference in Athens, 25-28 June 2019.
[2] Such an analysis is not yet possible due to lack of data.
References
Alvarez J.F. (2012). Mathematical expressions for the transit time of merchandise through a liner shipping network. Journal of the Operational Research Society, 63: 709-714.
Clark X., Dollar D., Micco A. (2004) Port efficiency, maritime transport costs, and bilateral trade. Journal of Development Economics, 75: 417-450.
de Langen, P. W. (1999) Time centrality in transport. International Journal of Maritime Economics, 1: 41–55.
de Langen P.W., Nijdam M., Van der Horst M.R. (2007) New indicators to measure port performance. Journal of Maritime Research, 4: 23-36.
Doi M. Tiwari P., Itoh H. (2001). A computable general equilibrium analysis of efficiency improvements at Japanese ports. Review of Urban and Regional Development Studies, 13(3): 187-206.
Ducruet C., Berli J. (2018) Measuring land-sea interactions at ports and cities : insights from geomatics and network analysis. Portus Online, 35: https://portusonline.org/measuring-land-sea-interactions-at-ports-and-cities-insights-from-geomatics-and-network-analysis/
Ducruet C., Bunel M. (2017) GeoSeastems: an innovative tool to map global shipping flows. Application to the Mediterranean region. Portus Online, 33: http://portusonline.org/en/geoseastems-an-innovative-tool-to-map-global-shipping-flows-application-to-the-mediterranean-region/#Ducruet C., Itoh H., Merk O. (2014) Time Efficiency at World Container Ports. Working Paper, International Transport Forum, no. 2014/08, Paris: OCDE Editions.
Ducruet C., Lee S.W., Ng A.K.Y. (2010). Centrality and vulnerability in liner shipping networks: Revisiting the Northeast Asian port hierarchy. Maritime Policy and Management, 37: 17-36.
Edmond E.D., Maggs R.P. (1976) Container ship turnaround times at UK ports. Maritime Policy and Management, 4: 3-19.
Goss R.O. (1967) The turn-round of cargo liners and its effect upon sea-transport costs. Journal of Transport Economics, 1: 75–89.
Guinand F., Pigné Y. (2015) Time considerations for the study of complex maritime networks. In: Ducruet C. (Ed.), Maritime Networks: Spatial Structures and Time Dynamics, London and New York: Routledge, pp. 163-189.
Haddad E.A, Hewings G.J.D., Perobelli F.S., Santos dos R.A. (2010) Regional effects of port infrastructure: A spatial CGE application to Brazil. International Regional Science Review, 33: 239-263.
Haralambides H.E., Cariou P., Benacchio M. (2002) Costs, benefits and pricing of dedicated container terminals. International Journal of Maritime Economics, 4: 21-34.
Heaver T.D., Studer T.D. (1972) Ship size and turnround time: Some empirical evidence. Journal of Transport Economics and Policy, 6: 32-50.
Hong Z., Merk O., Nan Z., Li J., Mingying X., Wenqing X., Xufeng D., Jinggai W. (2013) The Competitiveness of Global Port-Cities: The case of Shanghai – China. OECD Regional Development Working Paper 2013/23, OECD Publishing, Paris.
Itoh H. (2002) Efficiency changes at major container ports in Japan: a window application of Data Envelopment Analysis. Review of Urban and Regional Development Studies, 14(2): 133-152.
Itoh H. (2013) Market area analysis of port in Japan: An application of fuzzy clustering. The proceeding of International Conference of the International Association of Maritime Economists (IAME), Marseille, France, 3-5 July.
Itoh H., Tiwari P., Doi, M. (2002) An analysis of cargo transportation behaviour in Kita Kanto (Japan). International Journal of Transport Economics, 29: 319-335.
Leachman R.C., Payman J. (2012) Estimating flow times for containerized imports from Asia to the United States through the Western rail network. Transportation Research Part E, 48, 296-309.
Merk, O. (2013). The Competitiveness of Global Port-Cities: Synthesis Report, OECD Regional Development Working Paper 2013/13, OECD Publishing, Paris.
Moon W. (2013) The impact of port operations on efficient ship operation: from both economic and environmental perspectives. Paper presented at the International Conference of the International Association of Maritime Economists (IAME), Marseilles, France, 3-5 July.
Ng A.K.Y., Ducruet C. (2014) The changing tides of port geography (1950-2012). Progress in Human Geography, 38: 785-823.
Notteboom, T. E. (2006). The time factor in liner shipping services. Maritime Economics and Logistics, 8: 19-39.
Nyema S.M. (2014) Factors influencing container terminals efficiency: A case study of Mombasa entry port. European Journal of Logistics Purchasing and Supply Chain Management, 2(3): 39-78.
Parola F., Notteboom T.E., Satta G., Rodrigue J.P. (2013) Analysis of factors underlying foreign entry strategies of terminal operators in container ports. Journal of Transport Geography, 33: 72-84.
PortStrategy (2014) Manila backlogs mount up, 12 May. http://www.portstrategy.com/news101/world/europe/manila-backlogs-mount-up
Qi, X., Song, D.P. (2012). Minimizing fuel emissions by optimizing vessel schedules in liner shipping with uncertain port times. Transportation Research Part E, 48, 863-880.
Rodrigue, J. P. (1999). Globalization and the synchronization of transport terminals. Journal of Transport Geography, 7: 255-261.
Saldanha J.P., Russell D.M., Tyworth J.E. (2006) A disaggregate analysis of ocean carriers’ transit time performance. Transportation Journal, 45: 39-60.
Sequeira S., Djankov S. (2008) On the waterfront: An empirical study of corruption in ports. MPRA Paper 21791, University Library of Munich, Germany.
Slack B., Comtois C., Wiegmans B., Witte P. (2018) Ships time in port. International Journal of Shipping and Transport Logistics, 10(1): 45-62.
Slack B., Comtois C. (2013). Measuring ocean transit times of container shipping: an empirical study of the Trans Pacific trade. Paper presented at the International Conference of the International Association of Maritime Economists (IAME), Marseilles, France, 3-5 July.
Suarez-Aleman A., Trujillo L., Cullinane K.P.B. (2013). Estimating port efficiency through an alternative methodology: Time as an output of port efficiency. Paper presented at the International Conference of the International Association of Maritime Economists (IAME), Marseilles, France, 3-5 July.
Tongzon, J. (2001) Efficiency measurement of selected Australian and other international ports using data envelopment analysis. Transportation Research Part A. 35A (2): 107-122.
Tongzon J., Sawant L. (2007) Port choice in a competitive environment: from the shipping lines’ perspective. Applied Economics, 39, 477-492.
Vonck, I. (2014) The port vulnerability index. Paper presented at the Annual Conference of the International Association of Maritime Economists (IAME), Norfolk VA, 15-18 July.
Wang S., Meng Q. (2012). Liner ship route schedule design with sea contingency time and port time uncertainty. Transportation Research Part B, 46, 615-633.
Zohil J., Prijon M. (1999) The MED rule: The interdependence of container throughput and transshipment volumes in the Mediterranean ports. Maritime Policy and Management, 26: 175-193.
Head image: Vessel between world regions.